WordPress Website Speed Audit: Here’s How to Find and Fix Slow Pages
Is your WordPress website loading slowly, but you are not sure what is causing the problem? Changing plugins, hosting, themes, or cache settings without clear evidence can waste time and create new issues.
A WordPress website speed audit helps you identify which pages are slow, what is delaying them, and which fixes deserve attention first.
This guide shows you how to audit your site, understand the results, and create a practical plan to improve performance.
TLDR: Test key pages, compare Core Web Vitals with repeatable test data, and use the loading timeline to find bottlenecks. Fix one issue at a time and retest after each change. AirLift can simplify caching, image, and asset optimization.
A useful speed audit is not a PageSpeed score screenshot. It is narrower than a full WordPress performance audit, and it should connect each failed metric to a WordPress cause while protecting real user paths as you fix speed.
What a speed audit should answer
A WordPress speed audit should answer four questions:
Which pages are slow: homepage, posts, landing pages, product pages, checkout, account pages, or another template.
Which part is slow:server response, first screen, click response, layout stability, image delivery, scripts, database work, or third-party tools.
What evidence proves it:Core Web Vitals, PageSpeed field data, lab tests, cache status, server timing, and the browser loading timeline.
What to do first: one fix group with a retest plan and a rollback path.
Field data shows what real visitors experienced when enough data exists. Lab data is a controlled test that is easier to repeat while debugging. Use both when possible because each fills a gap the other leaves.
Note 🔎: If someone says, “the site is slow,” ask which page, device, and action felt slow. A slow checkout click, a late hero image, and a shifting product price usually need different fixes.
Choose the pages to test
Do not test only the homepage. WordPress sites use templates, and each template can load different images, scripts, plugin files, and database work.
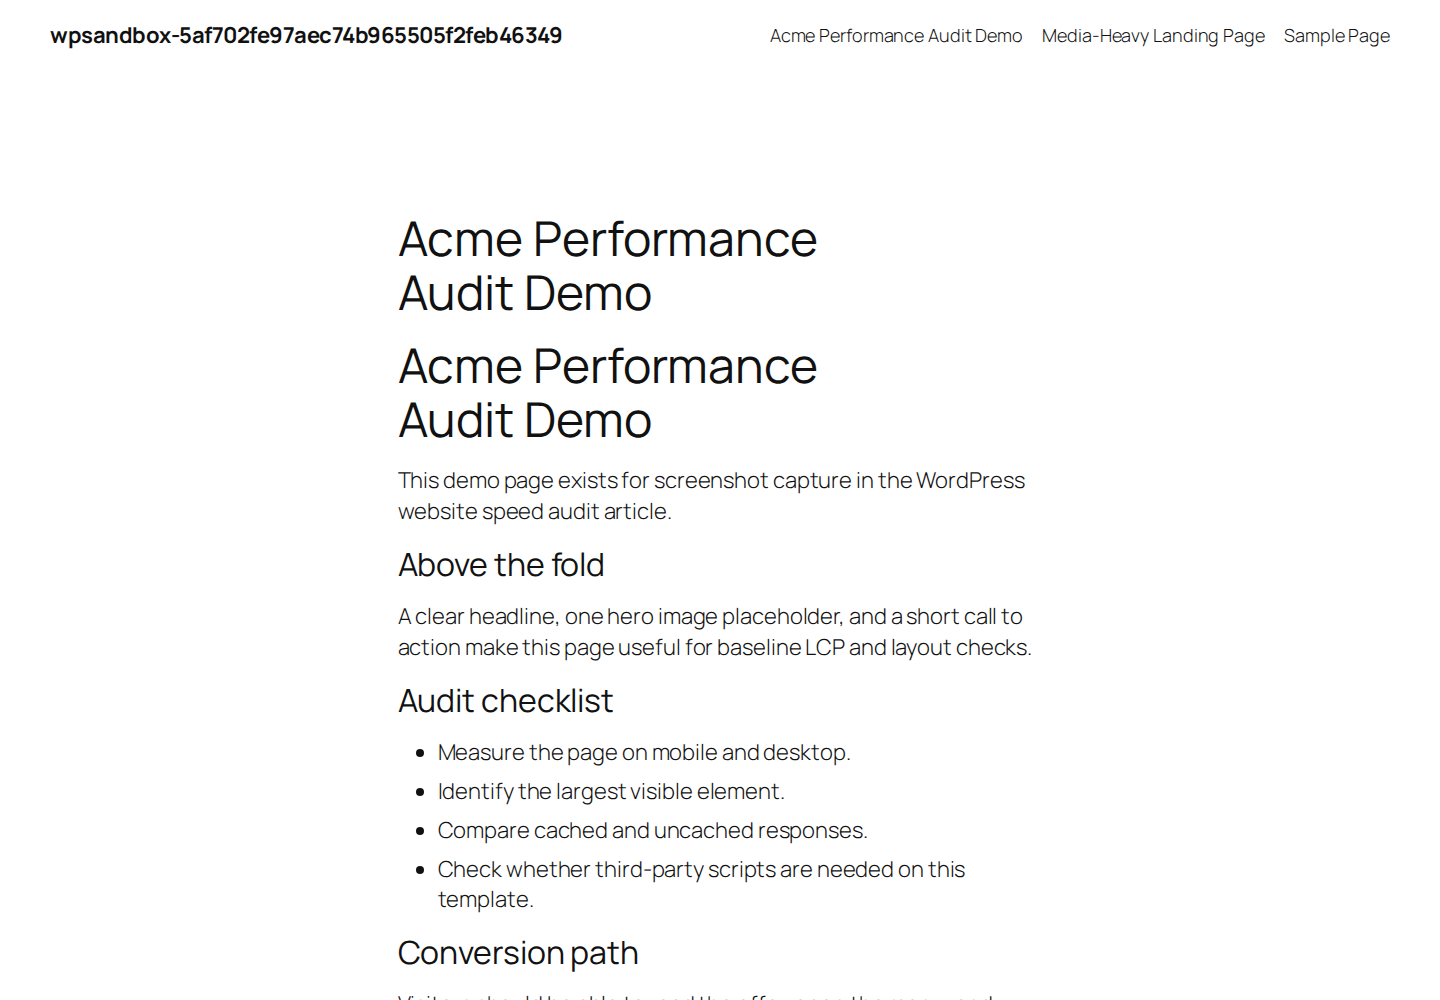
Choose pages that represent the site: homepage, one high-traffic post or page, one key landing page, one media-heavy page, and one recently changed page.
Include money pages and workflows: lead forms, pricing pages, booking pages, sales pages, product pages, cart, checkout, account pages, search, login, and registration.
Separate public and private pages: logged-out public pages can often use full-page cache, which stores ready-made HTML for faster repeat visits. Cart, checkout, account, membership, and logged-in pages often cannot use the same cache because they show personal data.
This page list keeps the audit honest. A fast blog post does not prove checkout is fast, and a slow admin page does not always affect visitors.
Capture a clean baseline
Before you touch settings, record the starting point. Without a baseline, you cannot tell whether a change helped or only moved the score when you measure website speed again.
Record the test setup: URL, date, device, test location, network setting when available, browser, and logged-in state.
Run mobile and desktop tests: mobile often shows more problems because the test device and network are slower.
Repeat the same conditions: scores can move because of network load, server load, browser work, and third-party response times.
Save the main evidence: Core Web Vitals, server response time, page size, request count, the largest first-screen element, cache status, and a loading timeline from Chrome DevTools, WebPageTest, GTmetrix, or a similar tool.
If PageSpeed Insights has no URL-level field data, the URL may be new, low traffic, private, blocked from crawling, or missing enough Chrome User Experience Report data. Use lab data and the loading timeline for debugging, then watch field data after the site gets enough visits.
Use the right tool for each job
Each tool should answer one part of the audit.
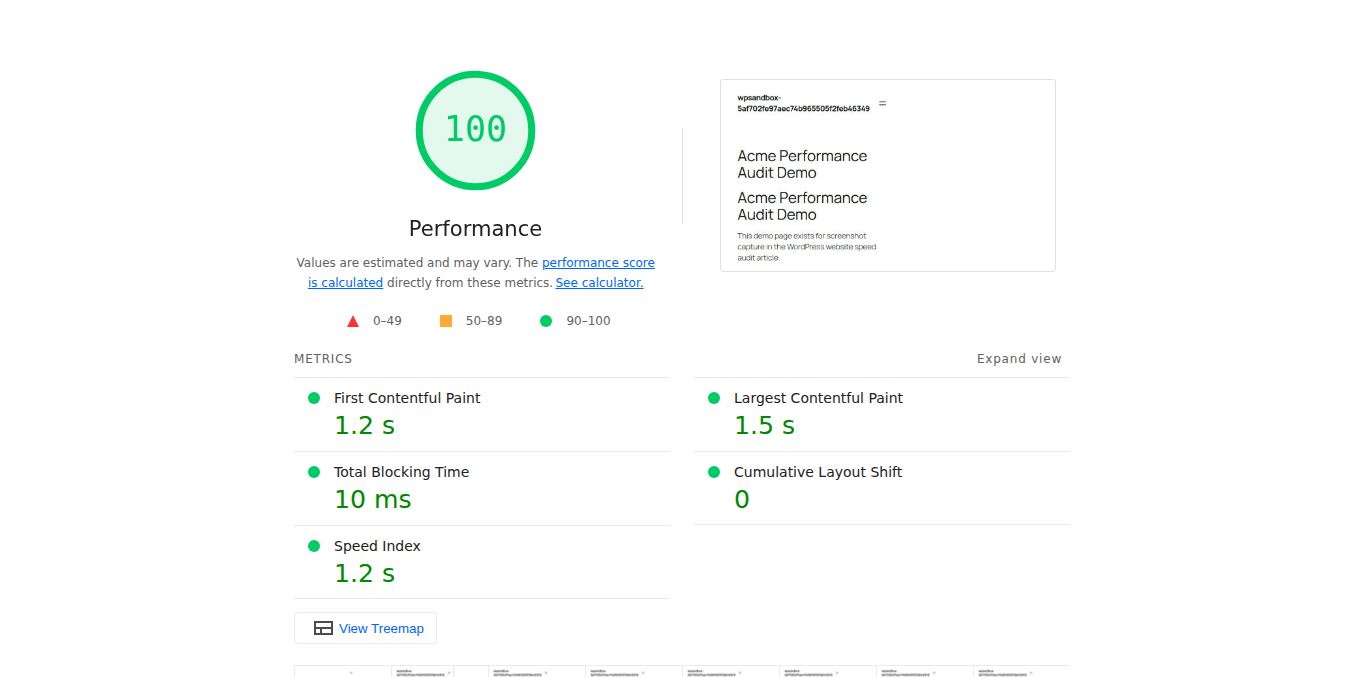
Use PageSpeed Insights for user metrics: it shows Core Web Vitals, lab results, field data when available, and Lighthouse diagnostics.
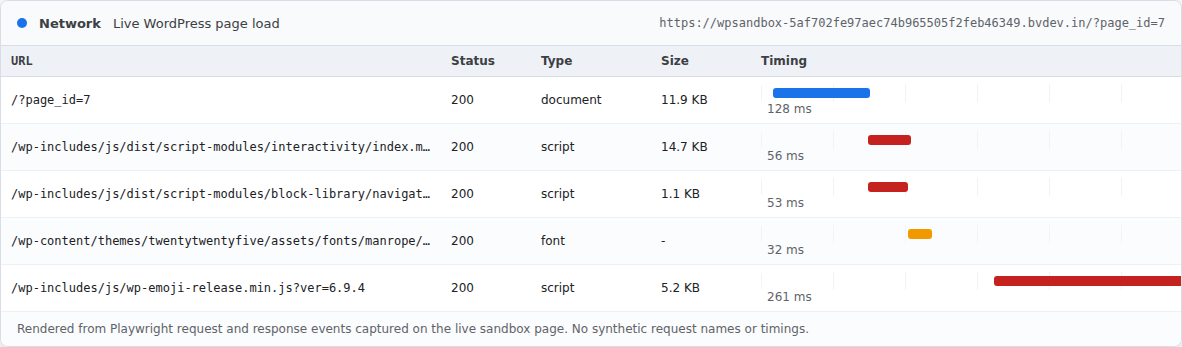
Use Chrome DevTools Network for the loading timeline: it shows file order, type, size, cache source, priority, status, and timing.
Use WebPageTest or GTmetrix for repeatable runs: they help compare locations, visual progress, repeat views, and request order.
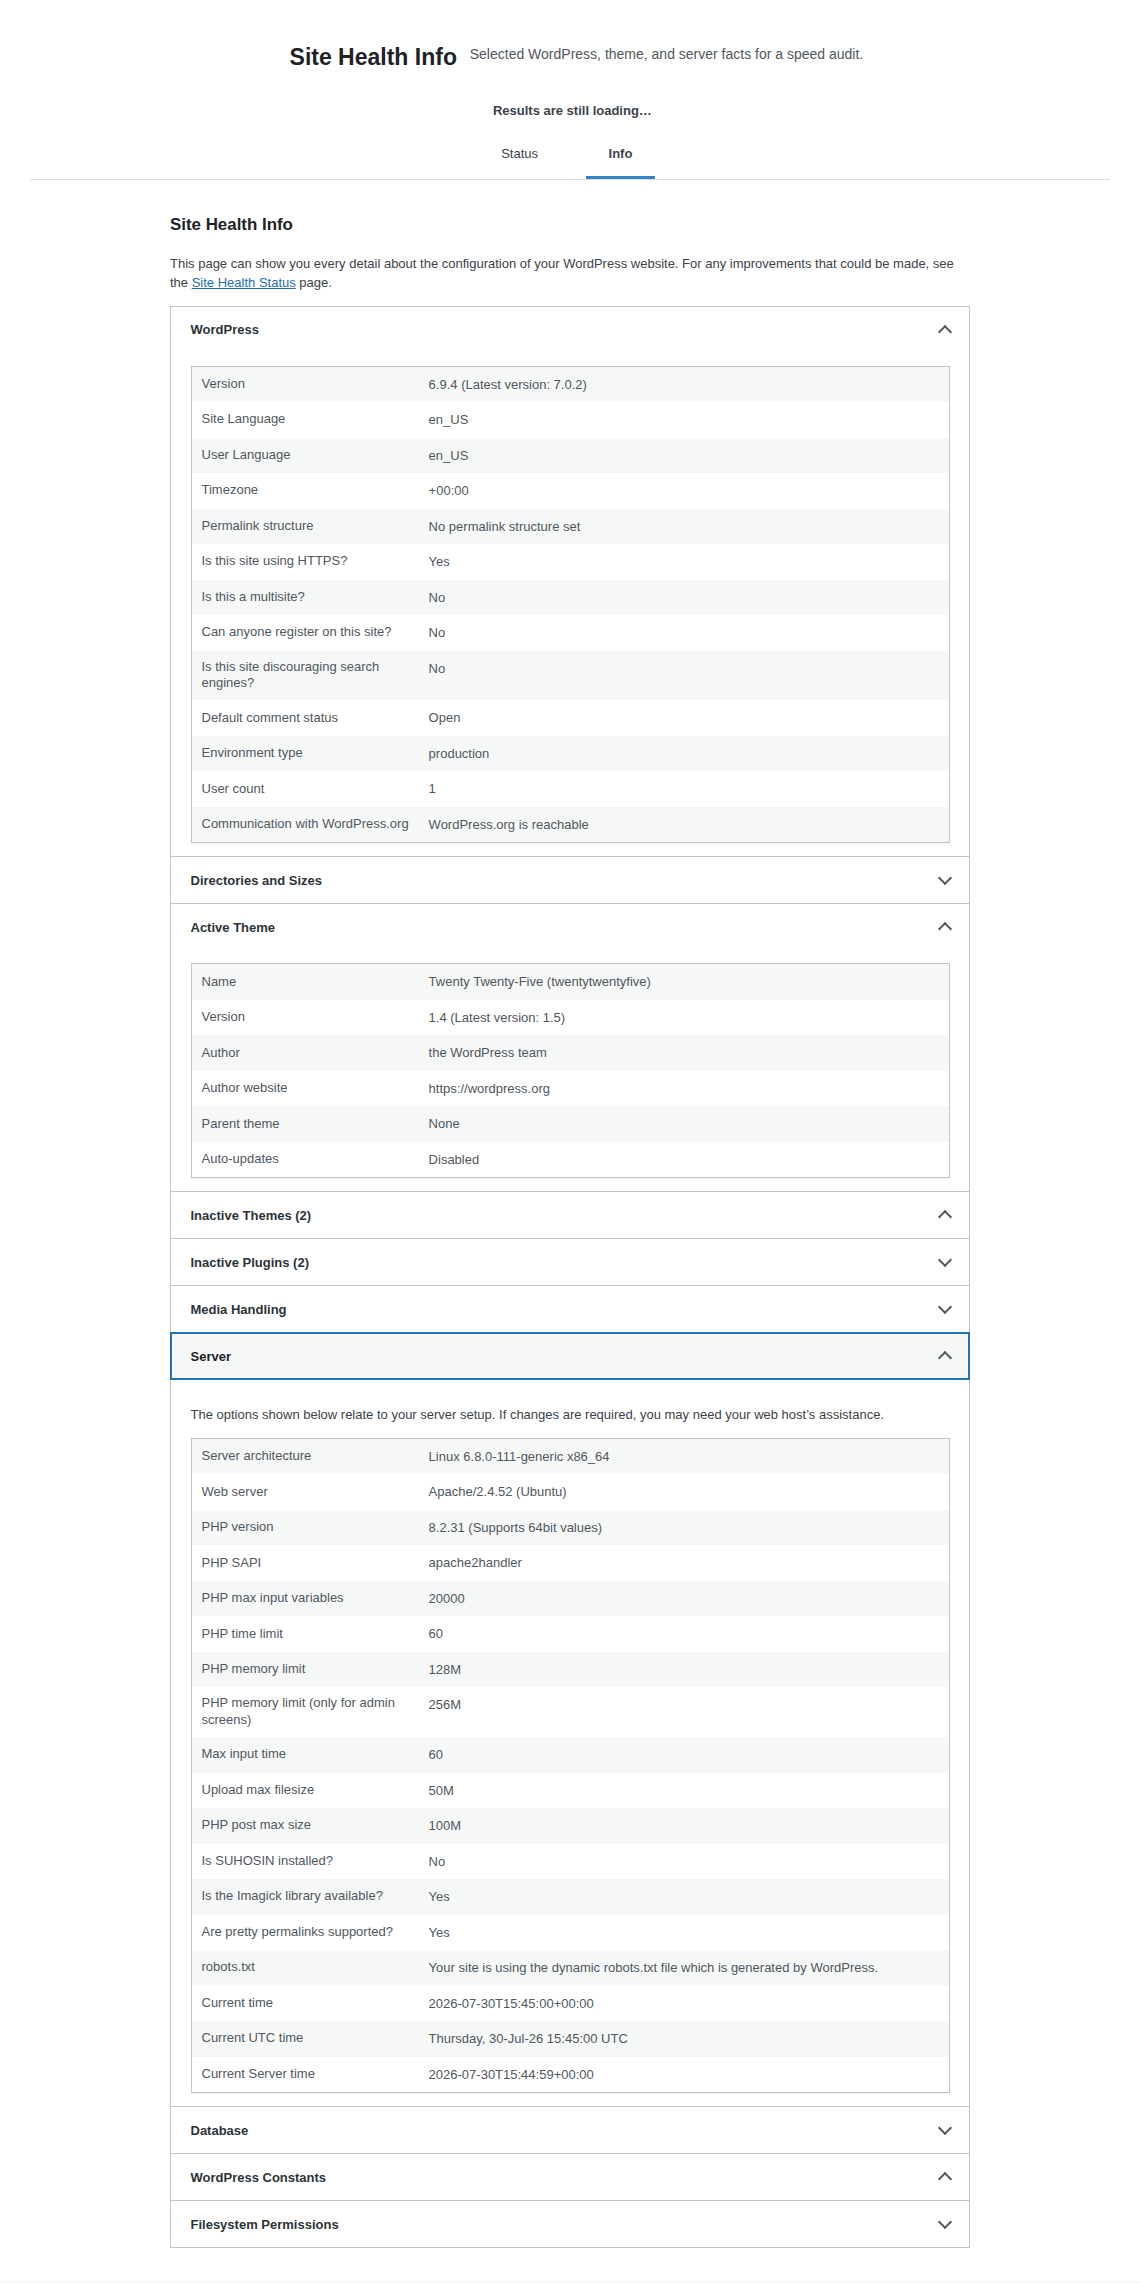
Use hosting, CDN, and WordPress admin data for setup checks: confirm PHP version, cache status, server resources, database size, plugin load, scheduled tasks, and CDN behavior.
The goal is to connect the symptom to the cause. If PageSpeed says LCP is slow, the loading timeline can show whether the server was late, the image was too large, the image was found late, or the page waited on CSS, JavaScript, or fonts.
Read the core metrics
Core Web Vitals are the main user-experience and also the performance metrics one should track.
Check INP, or Interaction to Next Paint: it measures how fast the page responds after a user clicks, taps, or types. Good INP is 200 milliseconds or faster. INP replaced FID as the stable interaction Core Web Vital in 2024.
Check CLS, or Cumulative Layout Shift: it measures unexpected movement while the page loads. Good CLS is 0.1 or lower.
Check TTFB, or Time to First Byte: it measures how long the browser waits for the first server response. PageSpeed Insights treats 800 milliseconds or faster as good, 800 to 1,800 milliseconds as needs improvement, and over 1,800 milliseconds as poor.
Lighthouse scores are useful summaries. A score of 90 or above is green, yet Google warns that good lab data does not guarantee good real-user experience.
Note ⚠️: Use the 75th percentile field result when it exists. That means the result reflects a slower slice of real visits, not just the best loads.
Diagnose the cause by metric
Start with the failed metric. This stops random optimization.
When the server responds slowly
High TTFB means the browser waited too long for the first HTML response. In WordPress, common causes include weak hosting, low CPU or memory, missed page cache, slow PHP work, slow database queries, slow external calls, long distance from the server to the visitor, CDN mistakes, or security filtering.
Check cache hits on public pages: a logged-out blog post or landing page should often return a fast cached response.
Check dynamic pages separately: cart, checkout, account, membership, and logged-in pages need different handling because they show user-specific data.
Check database-heavy sites for object cache:Redis object cache or Memcached can store repeated database results so dynamic pages do less repeated work.
If every tested page has high TTFB, check hosting, cache rules, server resources, and CDN setup before you resize images or delay scripts. If the slowdown appears with redirects, spam pages, or unknown files, scan the site for malware before treating it as only a performance issue.
When the first screen appears late
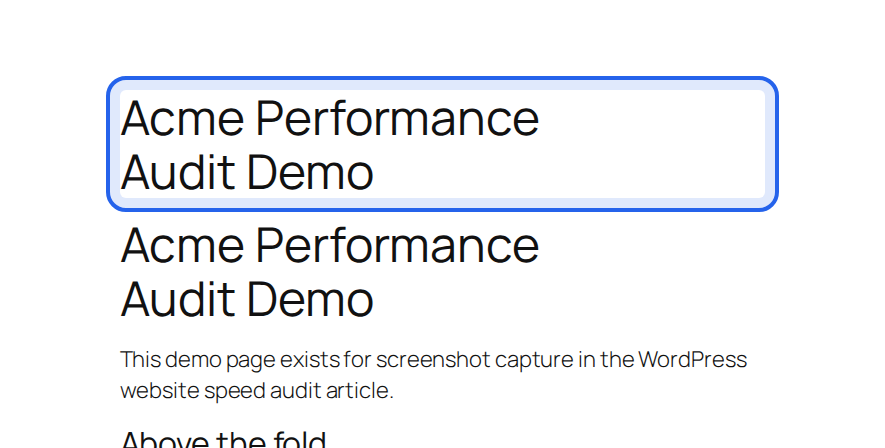
Poor LCP means the main visible element appears too late. In WordPress, that element is often a hero image, featured image, heading block, banner, slider, or above-the-fold page builder section.
Find the LCP element first: PageSpeed and Chrome DevTools can show which image or text block counted.
Match it to the loading timeline: check whether the HTML arrived late, the image was found late, the file downloaded slowly, or CSS, JavaScript, or fonts delayed display.
Treat the top image differently: do not lazy-load the likely LCP image. Lazy loading waits until the browser thinks a file is needed, which helps lower-page images but can hurt the main first-screen image.
Size and format the image properly: use the display size, add width and height, and use WebP or AVIF when your delivery setup supports them.
Note 🖼️: A slider can be worse than one strong first-screen image because it adds images, scripts, movement, and delay.
When clicks feel delayed
Poor INP means the page is slow to react after a visitor interacts. WordPress causes often include heavy JavaScript, page builder files, analytics, ads, chat widgets, heatmaps, tag managers, sliders, popups, consent banners, complex menus, and payment scripts.
Look for long browser tasks: a long task is browser work that blocks clicks, taps, or typing.
Unload files from pages that do not need them: a contact form script should not load on every blog post if the form appears on one page.
Test real workflows after script changes: menus, forms, search, analytics, consent tools, sliders, add-to-cart actions, and checkout can break when scripts are delayed or deferred.
Delay and defer settings can improve scores, but they can break real page behavior. Use them on a small group of files, then test the page as a visitor.
When the page jumps while loading
Poor CLS means visible content moves unexpectedly. Common causes include images or videos without width and height, ads or embeds inserted late, cookie banners, promo bars, font changes, sticky headers that change size, and animations that move layout boxes.
Reserve space for changing content: ads, embeds, banners, and videos need predictable space before they load.
Add dimensions to media: images and videos should tell the browser their width and height before the file finishes loading.
Avoid late content above the first screen: inserting a banner at the top after the page starts loading can push everything down.
Stabilize fonts and headers: font swaps and sticky header changes can move text and buttons.
Small shifts near the top can feel worse than bigger shifts lower down, especially around menus, prices, checkout fields, and call-to-action buttons.
Inspect the WordPress setup
After you know which metric failed, check the WordPress setup that can cause it.
Confirm PHP and server resources: old PHP versions, tight memory, or weak CPU can slow many requests.
Review page cache behavior: public pages should usually serve cached HTML to logged-out visitors. Cookies, query strings, or plugin rules can bypass cache by mistake.
Review object cache for dynamic sites: WooCommerce, membership, LMS, and logged-in sites often benefit more than simple brochure sites.
Audit plugin and theme load: one heavy plugin can cost more than several small ones. Look for files loaded sitewide when they belong on one template.
Check images, scripts, fonts, and third-party tags: large media, duplicate scripts, late fonts, font formats such as WOFF, ads, chat widgets, and tracking tags can slow the first screen and clicks.
Back up before database cleanup: database tools can remove revisions, transients, or stored data you may need later, so take a full WordPress site backup first.
This keeps fixes tied to evidence. If TTFB is high, a new image plugin is probably not the first move. If LCP comes from a hero image, changing hosts may not solve the main problem.
Prioritize the fixes
Fix the first proven bottleneck. Do not turn on every optimization setting at once.
Fix slow public responses first: verify page cache, CDN rules, server health, PHP version, and server bottlenecks.
Fix the first screen first: handle the LCP element, initial HTML response, hero image, blocking CSS, and first-screen rendering.
Fix delayed clicks first: reduce unused JavaScript, limit third-party tags, unload page-specific files, and test the workflow.
Fix layout movement first: add dimensions, reserve space, stabilize fonts, and control banners, ads, embeds, and animations.
Fix checkout carefully first: test payment scripts, shipping calculations, cart updates, database work, cache rules, and server resources.
Fix global delivery first: if visitors are spread across regions, test CDN routing, origin location, cache rules, image delivery, and third-party domains.
Fix repeat navigation carefully: when visitors move through many internal pages, test whether navigation prefetching helps without wasting bandwidth.
Note ⚠️: A CDN can help a global audience, but bad cache rules can serve stale content or expose pages that should stay private. Exclude cart, checkout, account, and logged-in pages unless the platform handles them safely.
Make safe changes and retest
Use staging when possible. For plugin and theme changes, safe WordPress updates are part of the same risk-control habit. If you must work on production, choose a low-traffic window and change one related group at a time.
Record the baseline before changing settings: save the URL, tool, device, location, key metrics, and screenshots if useful.
Change one fix group at a time: image work for LCP, script work for INP, cache work for TTFB, or layout work for CLS.
Retest under the same conditions: compare the same URL, device, location, and logged-in state.
Check real user paths: open menus, submit forms, search the site, add a product to cart, and run checkout in test mode when available.
Keep or roll back the change: keep changes that improve the metric without breaking the page. Roll back changes that only improve a score while hurting the visitor.
Combining CSS and JavaScript can be unnecessary on modern web connections that already handle many small files well. Removing unused CSS can also break mobile layouts, logged-in states, and plugin screens if it is too aggressive.
Decide what happens after the audit
Sort the final action list into four groups: WordPress settings, hosting or CDN, code changes, and monitoring.
Use a performance plugin when settings match the bottleneck: page caching, image optimization, safe lazy loading, minification, database cleanup, or asset control can help when the audit points there.
Change hosting or CDN when response time is the pattern: this matters when TTFB is high across many pages, the audience is global, cache rules are wrong, or the server is underpowered.
Bring in a developer when the cause is structural: custom code, theme files, page builder patterns, inefficient database queries, checkout logic, or broken script loading need careful work.
Use AirLift when you want WordPress-focused help applying the findings: AirLift fits after diagnosis, when you need help with caching, images, CSS, JavaScript, Core Web Vitals work, maintenance, and optimization settings that match the audit.
A performance tool is not the audit. It is one way to act on the audit. The best next step depends on the first proven bottleneck and the risk of changing it.
Keep the audit routine simple
Run a fresh audit after major changes: a new theme, builder, plugin, marketing tag, checkout tool, hosting move, CDN change, redesign, or important template update.
For a stable small site, a monthly check is usually enough. For ecommerce, lead generation, membership, publishing, or ad-supported sites, use weekly checks or alerts.
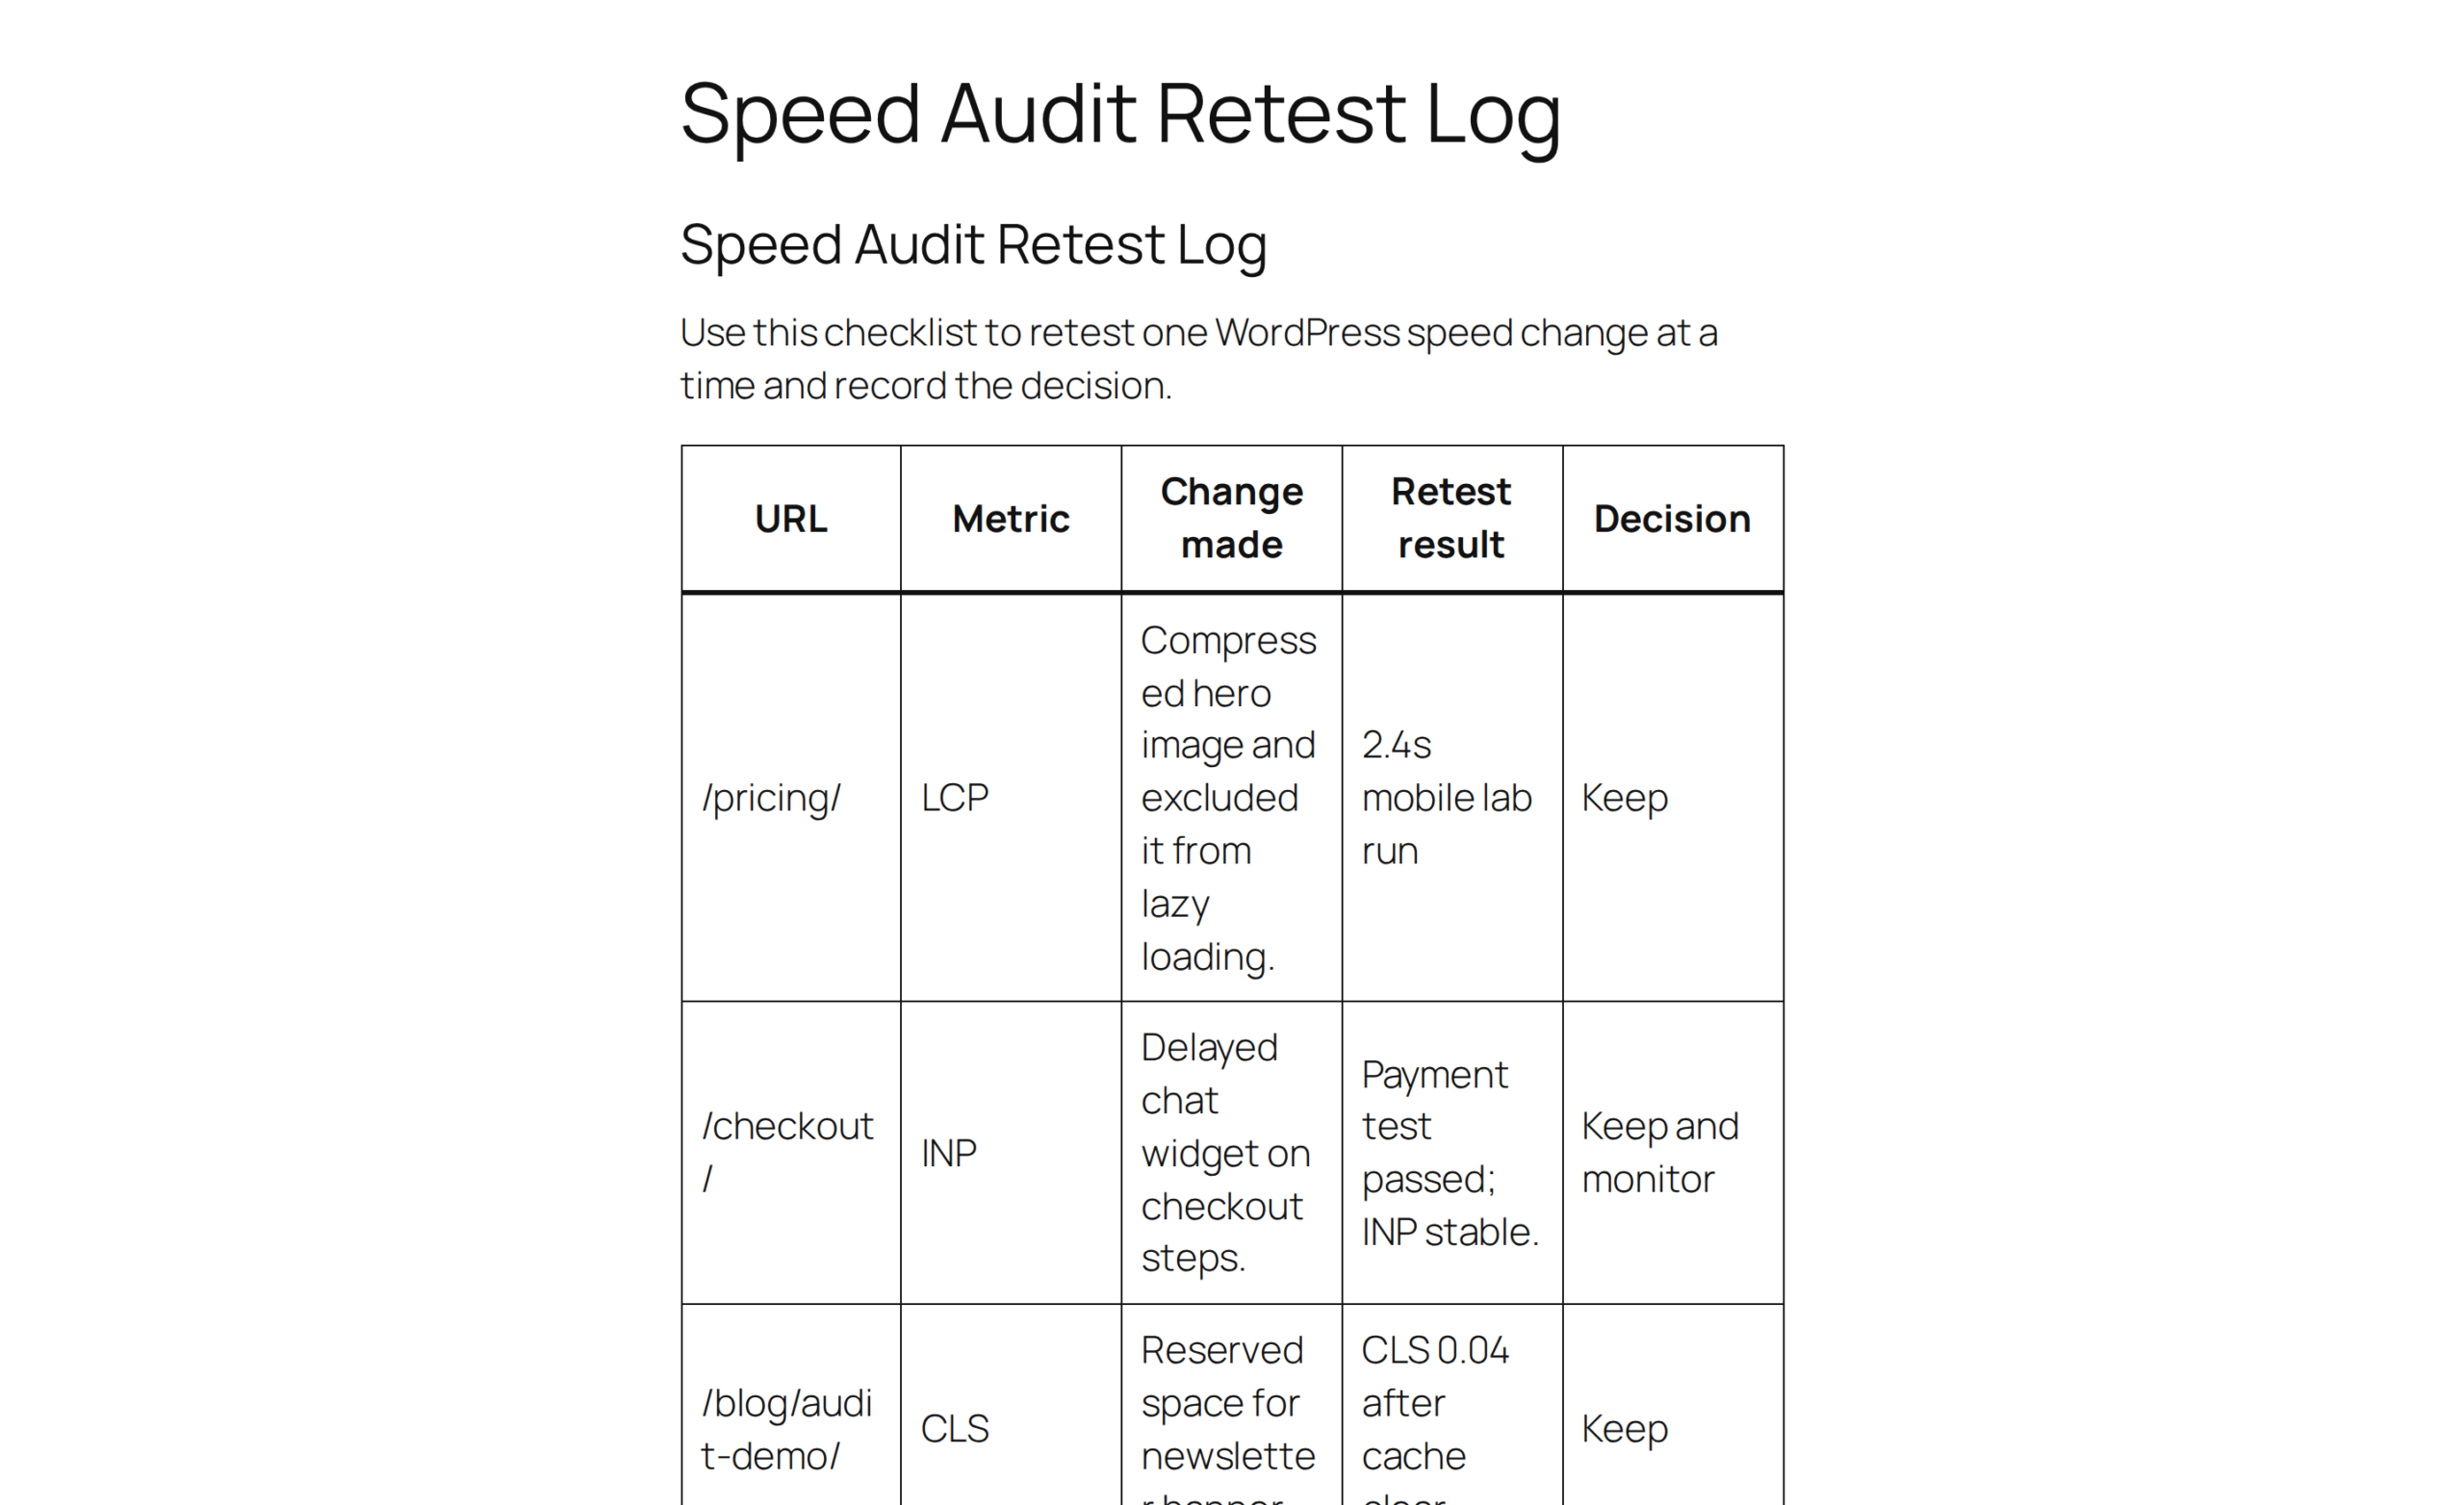
Keep a simple log with tested URLs, failed metrics, suspected causes, changes made, risks, retest results, and the final decision. That log saves time the next time someone says the site feels slow.
Quick WordPress speed audit checklist
Use this when you need the short version.
Choose representative URLs: include key templates, conversion pages, and dynamic pages.
Capture the baseline: record mobile and desktop results before changing anything.
Compare field and lab data: use real visitor data when available and lab data for debugging.
Match metric to cause: connect poor TTFB, LCP, INP, or CLS to likely WordPress issues.
Inspect the setup: review cache, PHP, plugins, theme, database, CDN, scripts, fonts, and images.
Retest and document: use the same conditions, note the result, and keep or roll back the change.
FAQs
What is a WordPress website speed audit?+
A WordPress website speed audit is a structured review of how fast important WordPress pages load and why they may be slow. It uses real visitor data when available, lab tests, Core Web Vitals, server response checks, loading timelines, and WordPress setup checks.
Which pages should I test first?+
Start with the homepage, one high-traffic post or page, one conversion page, one media-heavy page, and any page users complain about. For WooCommerce, also test product pages, category pages, cart, checkout, account, search, and login.
Why is my WordPress site still slow after caching?+
Caching mainly helps public pages that can be safely saved and reused. It may not fix slow checkout, logged-in pages, heavy JavaScript, large images, database issues, third-party scripts, or weak hosting.
What matters more: PageSpeed score or Core Web Vitals?+
Core Web Vitals and real visitor experience matter more. A PageSpeed score helps you spot problems, but a green lab score does not prove every visitor gets a fast page.
How often should I run a speed audit?+
Run an audit after major site changes and on a regular schedule. Monthly is fine for stable small sites. Weekly checks or alerts are better for WooCommerce, lead-generation, membership, publishing, and ad-supported sites.
Conclusion
A wordpress website speed audit works best when it stays calm and evidence-led. Test the pages that matter, read field data before lab scores when it exists, use the loading timeline to find the cause, and connect each failed metric to a WordPress-specific fix. That process keeps you from wasting time on settings that do not match the real problem.
Keep the work small and repeatable. Change one related group of settings, retest the same way, and protect important workflows such as forms and checkout. A fast WordPress site is not the one with the prettiest report. It is the one that loads quickly, stays stable, and lets visitors do what they came to do.
If you need help turning the audit into fixes, contact AirLift support.