

WordPress TTFB Very Slow? Find the Request That Is Waiting
PageSpeed’s “reduce initial server response time” warning can make a normal WordPress speed problem feel bigger than it is. If your report says WordPress TTFB very slow, the…
Read

Nothing in a WordPress slow server response time warning tells you what actually went wrong. “The server” could mean WordPress missed the cache. It could mean PHP got stuck, the database dragged, or the hosting ran out of room.
The useful translation is simpler: the first HTML response arrived late.
TL;DR: Check the first HTML request before you change settings. If saved public pages answer quickly but fresh WordPress requests lag, you don’t have an image problem. You’re looking at the work WordPress does before it can return HTML, which can include WordPress high CPU usage or another origin-side bottleneck.
I wouldn’t start by installing another performance optimizer. I’d first prove which layer is making the browser wait.
Before the browser can worry about images or scripts, it asks your server for the page’s HTML. The wait for the first byte of that response is called TTFB, short for Time to First Byte.
That’s the number behind the PageSpeed Insights and Lighthouse warning about reducing the initial server response. In Chrome DevTools, the same delay often appears as a long wait for the server response period on the main document request.
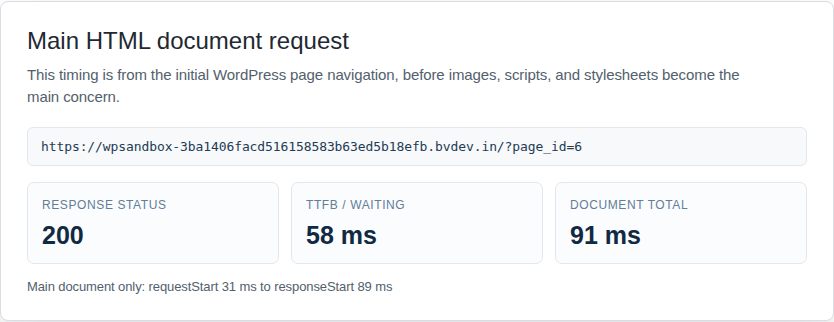
Google’s rough guide is to keep TTFB under 0.8 seconds. Above 1.8 seconds is poor. TTFB isn’t a Core Web Vital, but it sits in front of metrics like FCP and LCP. If WordPress TTFB is very slow, the browser is already starting late.
Keep that line clear in your head. A page can feel slow because of big images or heavy scripts. A slow server response means the delay happened before the browser had the page to work with.
🔎 Note: In DevTools, test the main HTML document, not the whole page load. If that first request is quick but visitors still wait, you probably need to speed up your WordPress site more broadly rather than focus on server response time.
Most bad performance fixes start with messy tests. One result comes from a logged-in browser. Another comes from a private window. Someone tests from the US, someone else from India, and now everyone is arguing over numbers that don’t belong together. Pick one slow URL and write down:
Run the same test a few times. You’re not looking for the prettiest score. You’re looking for a pattern you can trust. If you report on client sites, WP Remote’s PageSpeed integration can keep those checks visible beside maintenance work.

For most sites, I start with the homepage and one important inner page in a logged-out private window. On a WooCommerce site, I’d add one product page and keep checkout separate. Checkout, carts, accounts, and payment steps often need fresh data, so they don’t behave like a normal public blog post.
This is the first split I care about.
Test a public page while logged out. Test it once, then reload and test it again. If the second run is much faster, the first request may have missed the cache. If repeat visits stay fast, your page cache is probably working for that URL. Now test pages WordPress has to build fresh:
If public pages are fast but these pages are slow, don’t keep tuning full-page cache and expect a miracle. Full-page cache works by serving saved HTML. Dynamic pages may need to check a cart, load account data, confirm permissions, or prepare visitor-specific results.
That doesn’t mean your cache failed. It means this URL may not be safe to serve as the same saved copy to everyone.
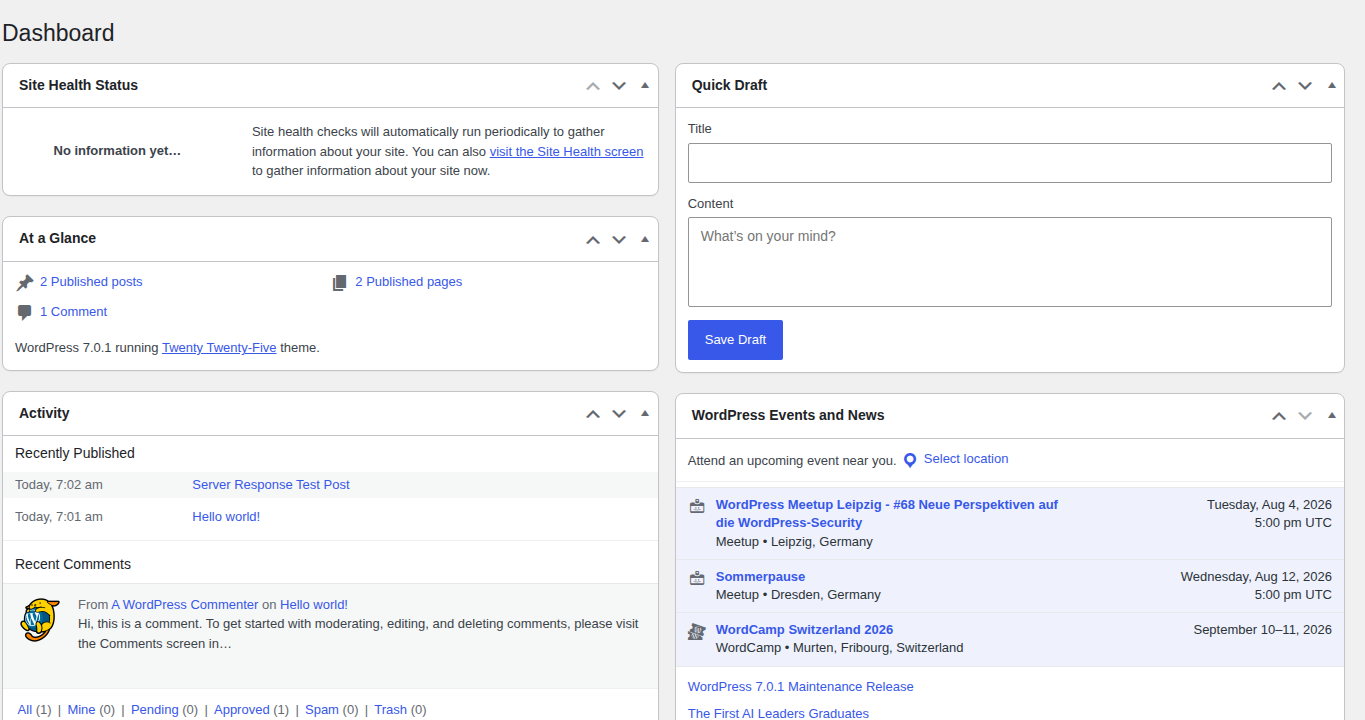
If even cached public pages respond slowly, widen the search. Weak hosting and overloaded shared servers can show up here. So can slow CDN routing, DNS/TLS overhead, or a cache layer that never actually answers the request.
⚠️ Note: Be careful with cache rules on checkout and login pages. Treat accounts, memberships, and forms with the same caution. A reckless rule can leak private data or break payments. Test those pages after every cache change, preferably on staging first.
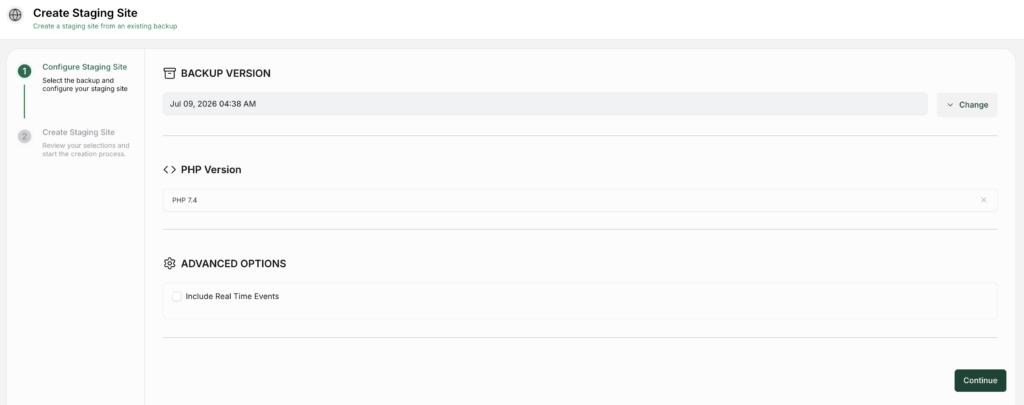
A site can have a cache plugin installed and still miss the exact pages you care about. I see this a lot.
Common reasons:
Response headers usually give you the fastest answer. A HIT usually means cache answered. Labels like MISS, BYPASS, DYNAMIC, and EXPIRED usually mean WordPress or the origin had to get involved. Provider wording varies, but the question doesn’t: did cache serve the page, or did WordPress build it?
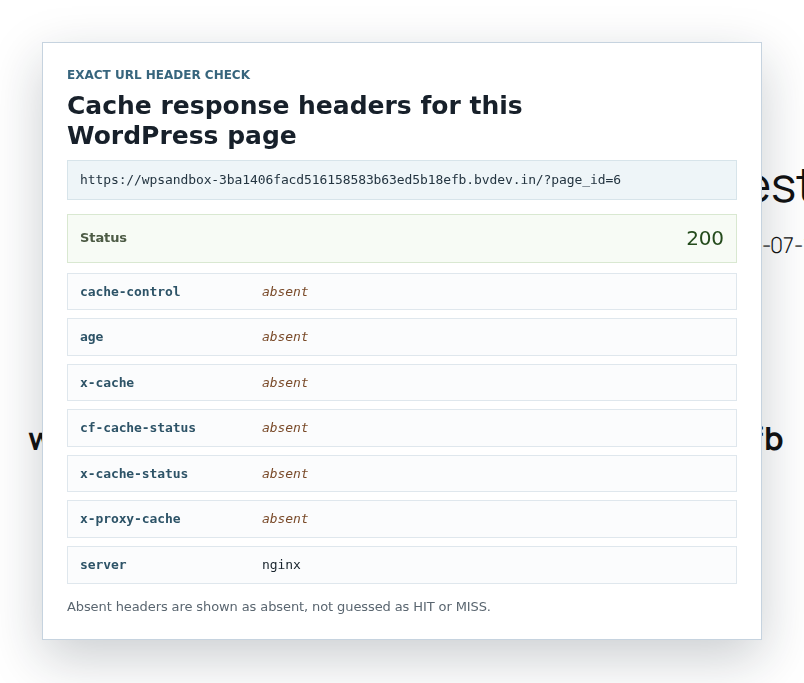
If headers aren’t your thing, send your host a sharper question:
Can you confirm whether page cache serves this exact URL for anonymous visitors? I tested it from a private window, and the initial HTML response is slow.
That ticket is harder to dodge than “my site is slow.”
When the cache doesn’t serve the page, PHP has to run. WordPress core loads first. Your theme and plugins then add their own work before the HTML goes back to the browser.
On a clean WordPress site, that can be quick. On a real site, the request may drag through a page builder template, ecommerce rules, translations, and form logic before it even gets to the final HTML. None of those are suspicious by themselves. The problem is the combination.
I once saw a reasonable ecommerce widget become a serious delay only when it was paired with translation handling. Remove either part, and the page improved. That’s why “disable plugins one by one” is crude but still useful. You’re not proving a plugin is bad. You’re finding the interaction that made this URL slow. Do this on staging:
The suspects vary by site. I usually look first at whatever touches the slow page: ecommerce code on product pages, filters on archives, memberships on account pages, page builders on landing pages.
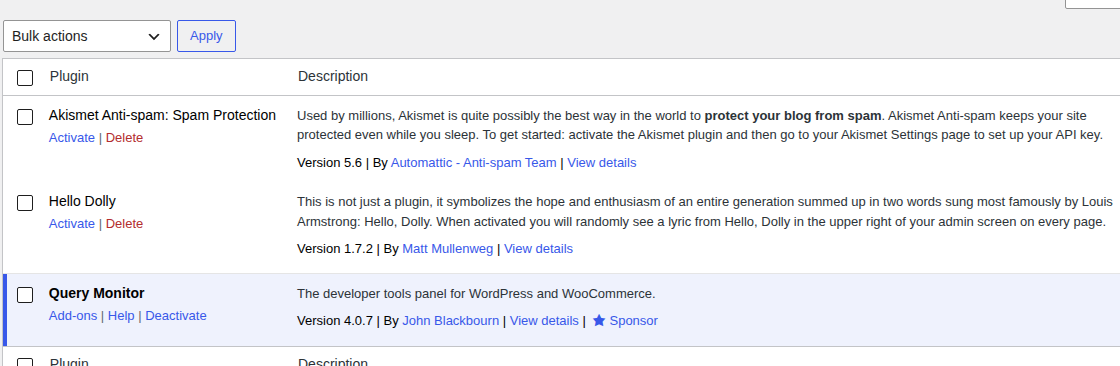
🧪 Note: Don’t run a blunt plugin test on production unless you’re comfortable breaking the page for a few minutes. Staging lets you be honest with the diagnosis without making visitors part of the experiment.
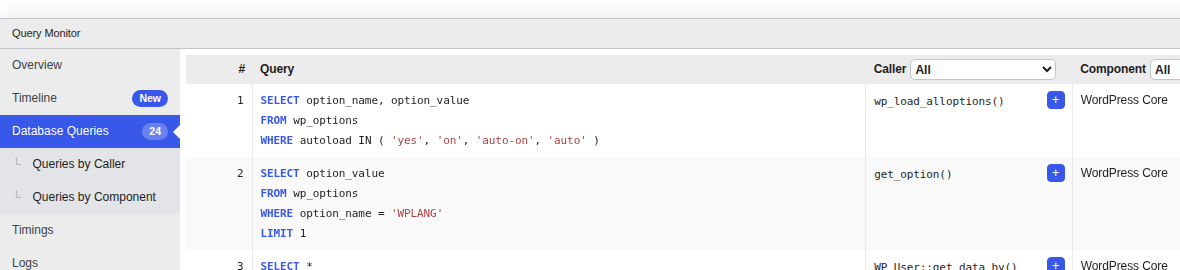
WordPress stores more than posts in the database. A normal request might touch site options, user records, product data, and plugin tables before the page is ready. One slow query there can make the server response crawl. Database trouble often shows up in patterns:
At this point, guessing gets expensive. Use Query Monitor on staging. If your host offers slow query logs or application performance monitoring, use those too. You’re trying to find the query, hook, plugin, or template part that owns the delay.
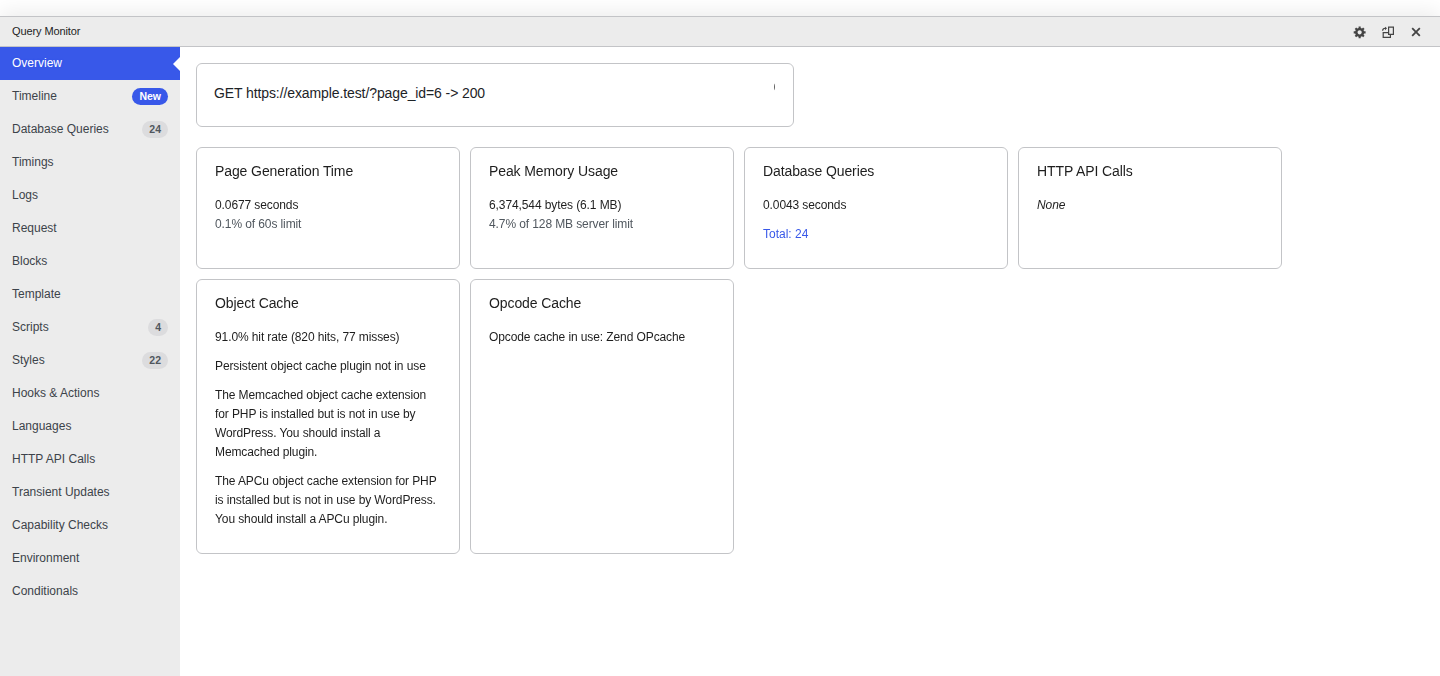
Object cache can help, but only when repeated database or object lookups are part of the slow path. Redis or Memcached won’t fix a slow external API call. It won’t rescue badly written PHP or a checkout flow that has to do real work for every visitor either.
💡 Note: Object cache makes the most sense on dynamic WordPress sites: WooCommerce, memberships, LMS sites, busy logged-in dashboards. A small brochure site usually gets more from clean page caching and decent hosting.
Hosting problems often feel inconsistent. One test is fine, the next is awful. The homepage looks okay because it’s cached, but wp-admin drags. Or the site is fine at night and slow at lunch. Ask for the actual server-side evidence: WordPress can give you a starting point before you open the hosting ticket.
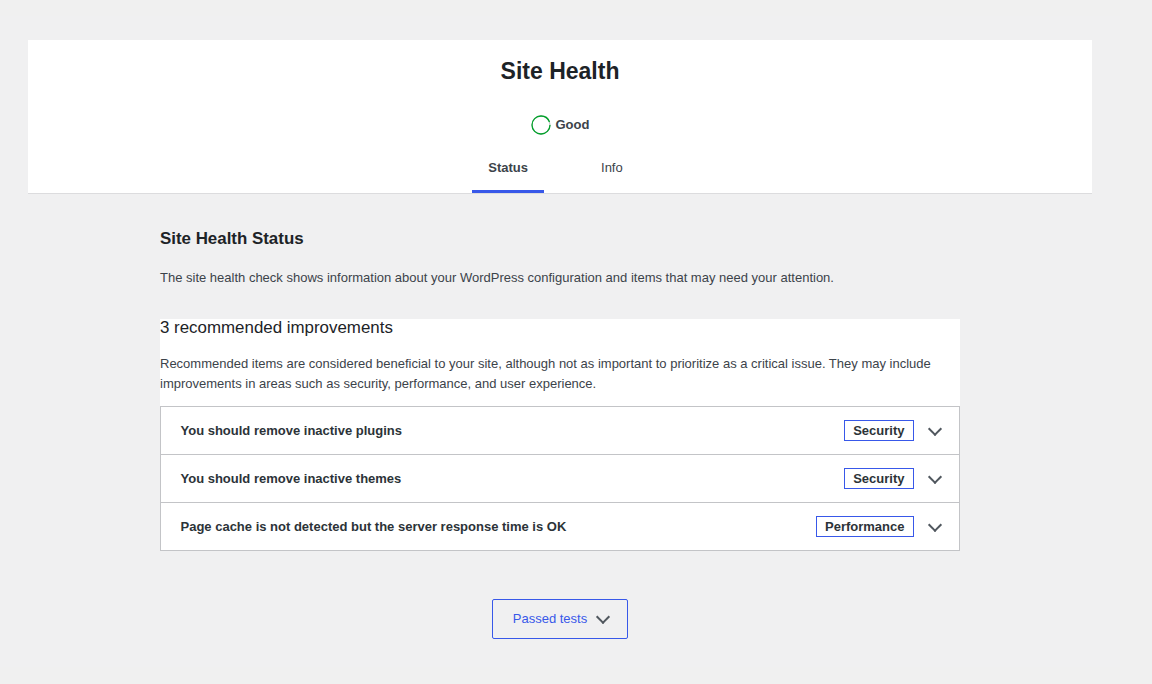
PHP workers deserve special attention. They decide how many uncached WordPress requests can run together. When workers are full, visitors wait in line before WordPress even starts doing useful work.
Also don’t let a nice-looking average CPU chart end the conversation. A single PHP request can get stuck on one busy CPU core while the total CPU number looks acceptable across the whole server. You don’t need to become a server engineer. You need your host to answer with evidence.
Some delays sit around WordPress rather than inside it. Redirect chains are the easiest cleanup. A URL might bounce from HTTP to HTTPS, non-www to www, then to a trailing slash before it reaches the final page. Each hop adds another wait. Fixing redirects won’t solve a slow database, but it makes every test cleaner.
Distance matters too. If your server is in one region and most visitors are far away, the round trip takes longer. A CDN can serve cached pages and assets closer to visitors. It still has to go back to the origin when checkout needs fresh WordPress work.
DNS lookup and TLS setup can add time before the HTML response begins. I wouldn’t tune these first on most WordPress sites, but they’re worth checking when cached pages are still slow.
Image compression and lazy loading are useful. CSS cleanup and script delay are too. They just usually don’t explain why the first HTML response arrived late.
Those fixes help after the browser has the page. They matter for page weight, LCP, and how quickly useful content appears. They are not the first answer to a slow initial document request.
I’d be careful with stacking performance plugins for the same reason. More tools can mean more rewritten files, more cache layers, more headers, and more debugging when checkout breaks. One performance setup with clear optimization controls is easier to trust than five tools fighting over the page.
If your testing shows a cache, CDN, image, CSS, or Core Web Vitals gap, AirLift fits that job. It handles page caching and CDN setup. It also covers image optimization, CSS improvements, Core Web Vitals fixes, and expert support. If your evidence points to PHP or database work, get that investigated too. The same goes for plugin conflicts and full PHP workers. A performance tool has to match the bottleneck.
Moving hosts can fix the problem. It can also waste a weekend and leave the real issue untouched. I would consider a hosting upgrade when:
You may not need a huge plan. Sometimes the jump from crowded shared hosting to managed WordPress hosting is enough, especially when it adds better page cache, enough PHP workers, OPcache, and stronger database resources. Sometimes your host is fine and one plugin is wasting two seconds on every uncached request. The test should decide.
If I were looking at your site with you, this is where I’d start:
The point isn’t to make troubleshooting complicated. It’s to stop changing three things at once and hoping one change happened to be right.
A WordPress slow server response time warning isn’t a command to install more plugins. It’s a clue that the first HTML response is late.
Start with the document request. Check cache. Compare cached and dynamic pages. Then look at the WordPress work behind the request: PHP, plugins, database queries, and hosting limits. After that, clean up redirects and distance issues. Once the slow layer is clear, the fix usually gets smaller and safer.
You can tune cache with confidence, send your host a useful ticket, challenge a heavy plugin, or bring in a performance tool where it actually fits. That’s how you get a faster site without breaking the parts customers rely on.
Aim for TTFB under 0.8 seconds where possible. Above 1.8 seconds is poor. Dynamic pages like checkout, account areas, and logged-in dashboards may be harder to optimize, but they shouldn’t be ignored if customers use them.
No. TTFB is not a Core Web Vital. It still matters because the browser can’t show meaningful content until the HTML starts arriving. High TTFB makes LCP harder to improve.
It can help when the slow URL is a cacheable public page and cache is missing it. It won’t fully fix slow PHP, slow database queries, external API delays, weak hosting, or pages that must stay dynamic.
Usually not the initial HTML response. Images affect page weight, bandwidth, LCP, and the visible loading experience after HTML arrives. They matter, but they’re rarely the root cause of slow TTFB.
Send the exact URL, test time, test location, and login state. Include the TTFB and cache-header result if you have them. Then ask about PHP workers and OPcache first. After that, ask them to check memory pressure, disk waits, slow queries, repeated errors, and traffic spikes during that same window.
PageSpeed’s “reduce initial server response time” warning can make a normal WordPress speed problem feel bigger than it is. If your report says WordPress TTFB very slow, the…
Read

Is your WordPress website loading slowly, but you are not sure what is causing the problem? Changing plugins, hosting, themes, or cache settings without clear evidence can waste…
Read

Reports don’t make this easy: Core Web Vitals assessment failed WordPress can sit beside a performance score that doesn’t look that bad. That’s the part that throws people. The…
Read
Airlift works out what each page needs and applies it. Free to try on your own site.