

WordPress Dashboard Slow? Fix the Right Problem First
There is a very specific irritation in opening WordPress to make one small edit and then waiting on the dashboard like it’s thinking about whether you deserve access today. The…
Read

Reports don’t make this easy: Core Web Vitals assessment failed WordPress can sit beside a performance score that doesn’t look that bad. That’s the part that throws people. The warning sounds final, but the report is showing two different kinds of evidence.
It usually isn’t. The failed assessment means Google’s real-user data shows that visitors had a poor experience on at least one Core Web Vitals metric: LCP, INP, or CLS.
The score you just ran is a lab test. The assessment is based on field data, when Google has enough of it, over roughly the last 28 days.
TLDR: First, identify the failed metric, device, and URL group. Then change the WordPress setting or template issue that matches it: LCP is first-screen loading, INP is interaction delay, and CLS is layout movement. If you are comparing tools before making changes, WordPress performance optimization plugins are a useful wider reference.
That order matters. Most wasted Core Web Vitals work starts when someone sees “failed,” opens a performance plugin, and turns on every setting that sounds fast. If your goal is to safely speed up your WordPress site, I’ve done enough performance work to say this plainly: a failed assessment is a diagnosis problem before it’s an optimization problem.
Core Web Vitals measure three parts of the visitor’s experience:
| Metric | Good target | What it means in normal language |
|---|---|---|
| LCP | 2.5 seconds or less | The main first-screen content appears quickly |
| INP | Under 200 milliseconds | Taps, clicks, and typing get a fast response |
| CLS | 0.1 or less | The page doesn’t jump around while loading |
Google looks at the 75th percentile, separately for mobile and desktop. So this isn’t about your fastest visit, your office Wi-Fi, or the one clean Lighthouse run you just triggered. It’s asking whether most real visitors had a good enough experience.
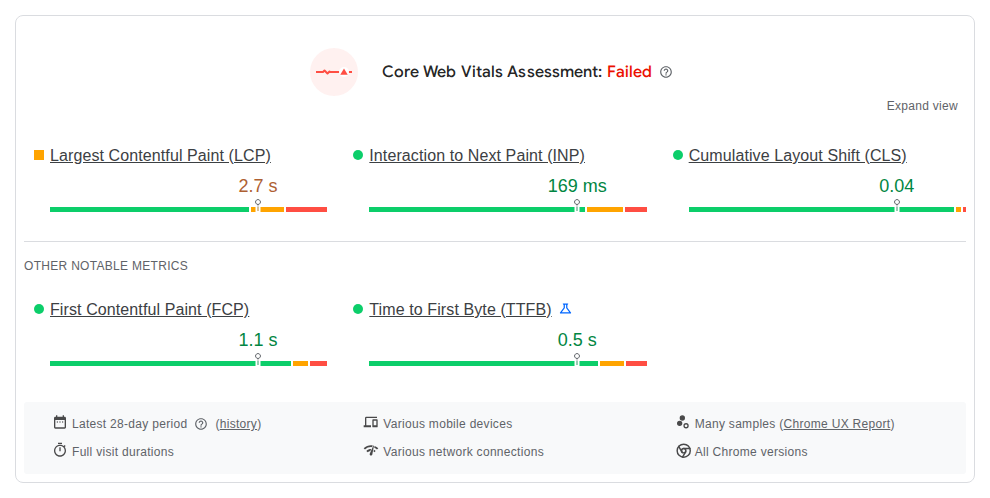
On WordPress, that distinction is everything. A cached homepage on desktop may look fine. Meanwhile, mobile visitors on posts or product pages might still be waiting on a heavy hero image, blocked by scripts, or watching content move after an ad loads.
🧭 Note: If only one metric failed, don’t treat the whole site as broken. A slow site is usually the result of a single bottleneck, not a total breakdown. A page can have great CLS and terrible LCP, or fast loading and awful INP. Fix the failed experience, not the entire performance universe.
A failed assessment also doesn’t mean Google has handed your site a sitewide penalty. These performance metrics feed into page experience, and page experience can matter in search, but relevance still matters more. I would fix the warning because it points to real friction for users, not because one red label has magically cancelled the rest of your SEO.
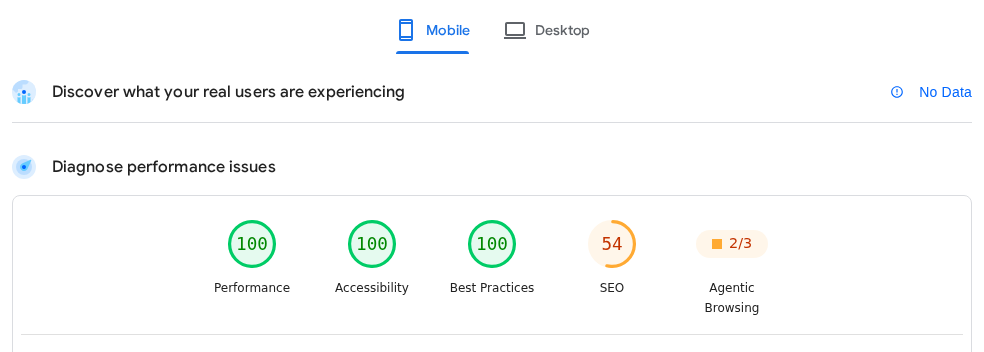
PageSpeed Insights puts two different measurements on the same screen:
Both can be true at the same time. A page can score well in a fresh lab test and still fail Core Web Vitals because visitors over the last few weeks had a slower, messier experience.
The common reasons are very WordPress-shaped:
Before you touch a setting, look for the small labels in the report. URL-level data is about that URL. Origin-level data is about the whole domain. If PageSpeed is showing origin data, don’t spend three hours perfecting one blog post just because that happens to be the URL you tested.
🔎 Note: For this job, Search Console usually beats a single PageSpeed test because it groups similar URLs. If a group is mostly product pages, fix the product-page template first. If it’s mostly posts, look at the post template. That’s where the field failure is probably coming from.
Before changing anything, perform a full WordPress performance audit using this checklist:
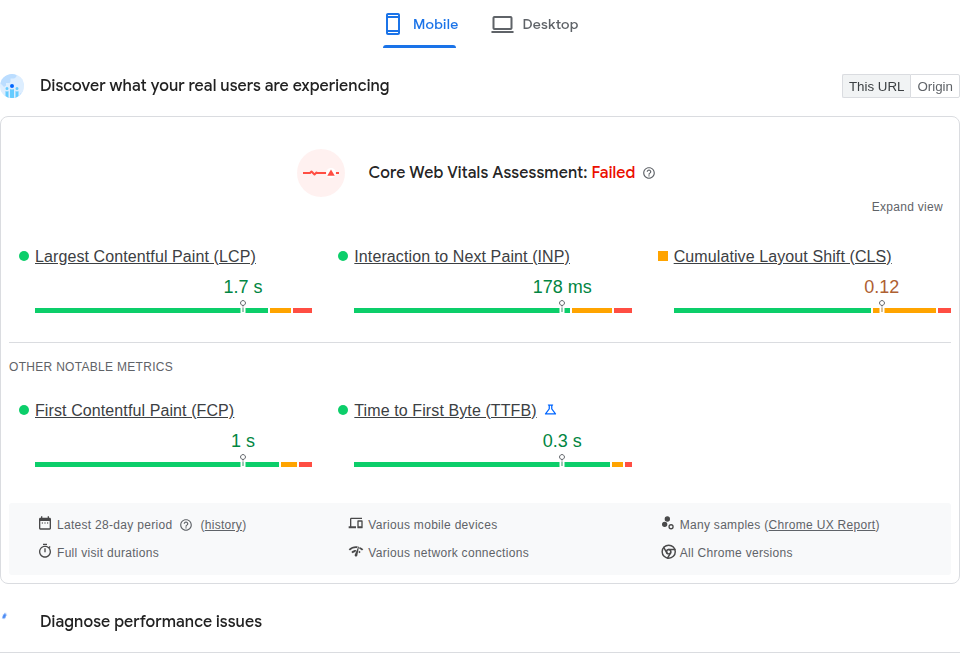
That last part looks minor, but it saves a surprising amount of wrong work. WordPress admins often test while logged in, with admin-bar scripts, uncached pages, or local browser state changing the result. Your visitors don’t see that version.
Also separate failed from not applicable. Not applicable usually means Google doesn’t have enough field data for that page or origin. It isn’t a pass. It also isn’t a fail. Use lab tests and manual testing for clues while you wait for enough real-user data.
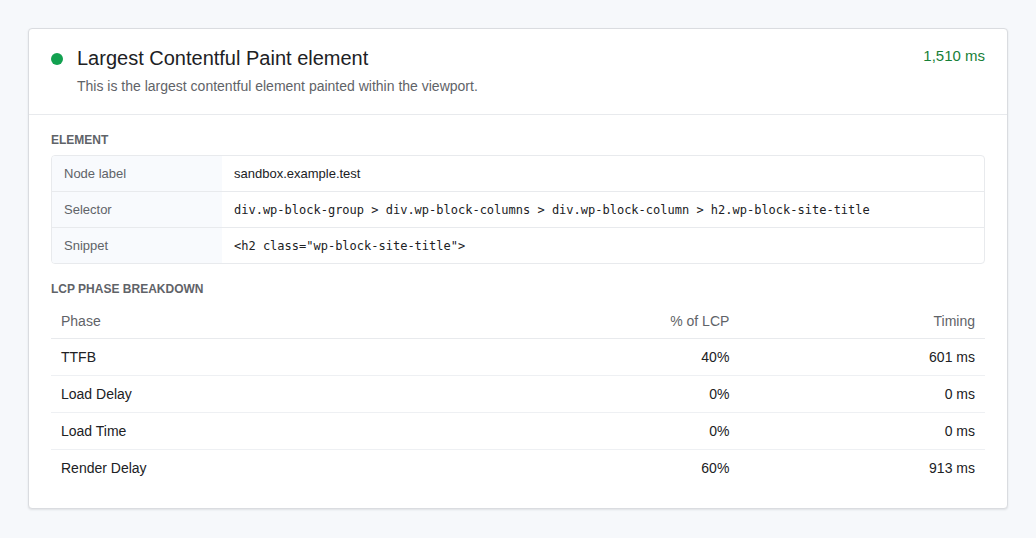
Largest Contentful Paint (LCP) measures when the main visible element appears on the first screen.. On WordPress sites, the measured element is often the hero area: a featured image, product photo, headline block, or page-builder section.
Start with the measured LCP element in PageSpeed. Don’t guess. I’ve seen people run bulk image compression when the delay was really a text block waiting on CSS and fonts. I’ve also seen the opposite: careful font work while mobile visitors were still downloading a huge desktop hero image.
Check these first:
The server-response part deserves more attention than it usually gets. If field TTFB is around 1.9 seconds, you’ve already spent most of a 2.5-second LCP budget before the main content has a chance to appear. In that case, image compression alone won’t save the page.
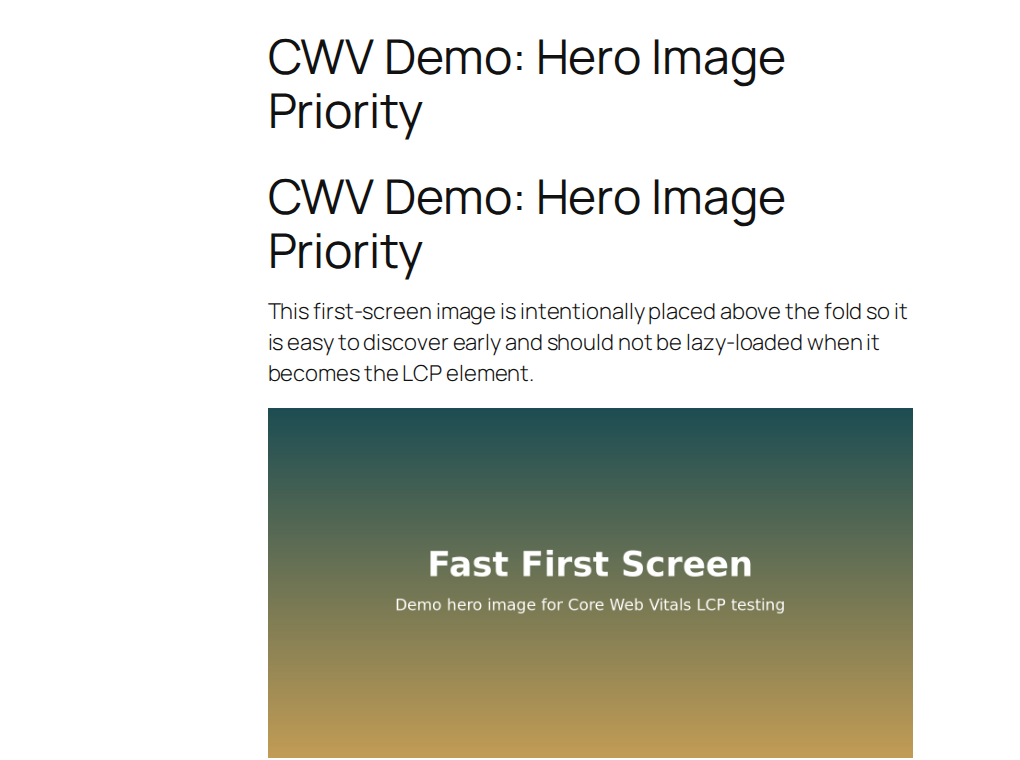
⚡ Note: Lazy loading is great below the fold. It’s a mistake for the LCP image. If your hero or featured image is the first thing visitors need to see, let the browser find it early and give it priority.
Once the LCP cause is clear, a tool like AirLift can help with the repeatable WordPress work. For an LCP failure, that usually means better cache coverage, lighter images, or first-screen CSS. It may also mean CDN delivery, font handling, or cleaner asset loading. That’s a sensible next step after diagnosis. It isn’t a substitute for knowing whether LCP failed because of hosting, cache bypass, a hero image, or render-blocking assets.
Interaction to next paint INP is the one that makes people doubt the report because the page may look loaded. The lag only shows up after a visitor uses the page: tapping the menu, typing into a field, opening filters, or submitting a form.
Tap the mobile menu. Open filters. Type into search. Add a product to cart. Apply a coupon. Click through checkout fields. If the page pauses before responding, that’s the kind of delay INP is measuring.

WordPress sites are especially good at creating this problem by accumulation. A theme adds scripts. A page builder adds more. WooCommerce adds its own work. Forms, analytics, consent tools, and ad scripts add more. Chat widgets, heatmaps, and popups can pile on after that.
Each script may have a reason to exist. The browser still has to run the pile.
Fixing INP is usually less glamorous than chasing a PageSpeed score:
🛒 Note: Be very careful with WooCommerce and membership sites. Caching and JavaScript delay can improve a test while breaking carts, checkout, logged-in pages, or personalization. A faster report that loses orders isn’t an improvement.
One more thing: if an older article or audit tells you to fix FID, translate that to INP. FID used to be the interactivity metric. INP replaced it because it looks at more interactions across the page visit, which is much closer to how modern WordPress pages actually feel.
Cumulative Layout Shift (CLS) measures layout movement. If layout stability is your primary failure, our guide on how to reduce CLS on WordPress breaks down the fix. In real life, it looks like this: you start reading, and the paragraph jumps. You reach for a button, and a banner pushes it down.
This is usually visible if you slow down and watch the page on a phone. Don’t scroll immediately. Load the page, wait, and notice what moves. Common WordPress causes include:
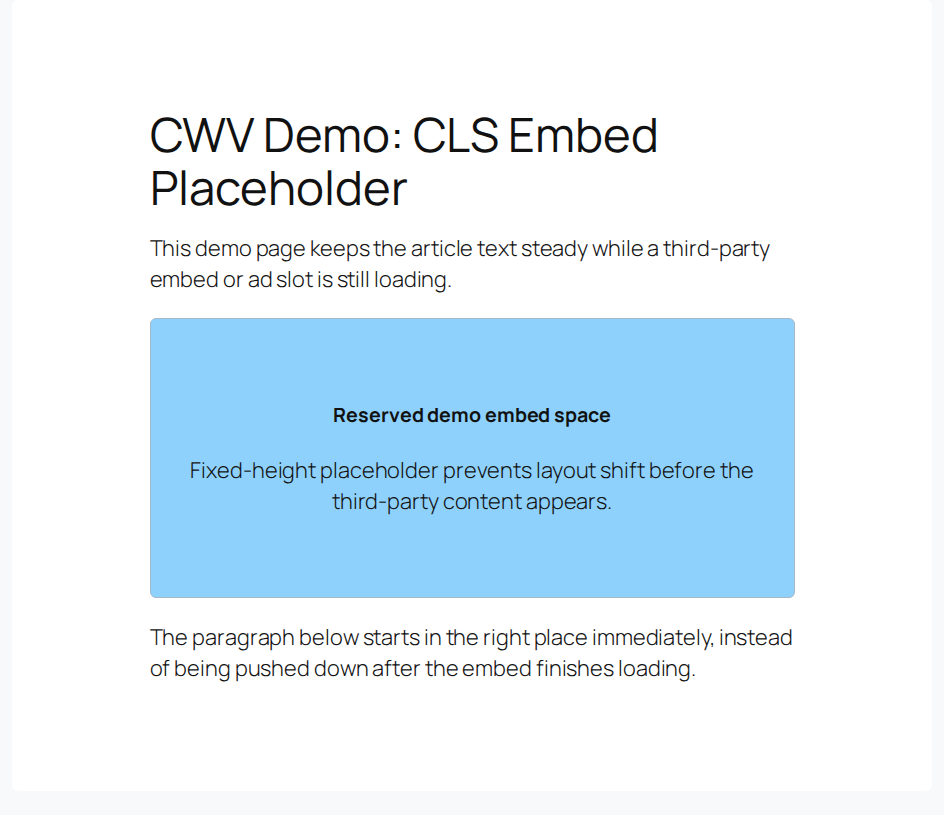
The fix is often simple once you find the moving element: reserve the space before it loads, make first-screen content stable, and stop late banners from pushing the page around.
📐 Note: For embeds and ads, don’t wait for the third-party service to tell the layout what size it wants. Give the container a stable size first. The page should already know where everything belongs.
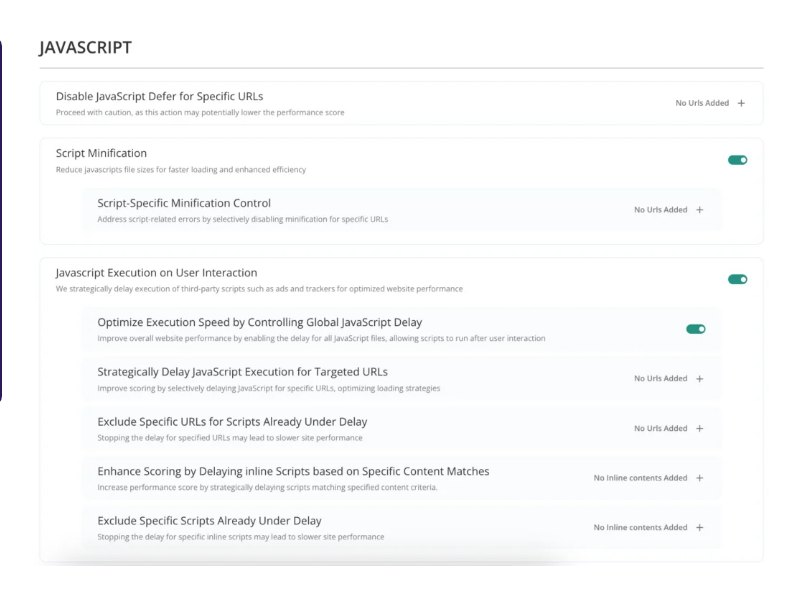
Performance plugins can help a lot, but you need to enable caching in WordPress without breaking key pages like cart or checkout screens. Turning every option on at once usually creates new problems.
Use this as a quick map:
| Setting | Can help with | Be careful with |
|---|---|---|
| Page caching | LCP and slow TTFB | Carts, logged-in states, memberships, personalized pages |
| Image optimization | LCP and bandwidth | Blurry hero images, wrong mobile dimensions, lazy-loaded first image |
| Critical CSS | LCP and render delay | Missing styles or broken builder layouts |
| Unused CSS removal | Page weight and render delay | Forms, menus, popups, and dynamic blocks losing styles |
| JavaScript delay | INP and main-thread work | Menus, checkout, consent, forms, analytics timing |
| Font optimization | LCP and CLS | Text shifts when fonts swap |
| CDN delivery | Asset speed | Purge issues and stale files |
After each meaningful change, run the site like a visitor:
That change log feels tedious until field data starts moving days later and you need to remember what changed. If you flip twelve switches in one sitting, you won’t know which one helped or which one broke the mobile menu.
🧪 Note: “Enabled” doesn’t always mean “working.” Critical CSS, unused CSS removal, and similar features can fail silently because of CSS errors, processing limits, or plugin conflicts. Check the front end after enabling them.
AirLift makes sense after you’ve identified the failed metric and the WordPress layer behind it. If the issue is ordinary WordPress performance work, AirLift can handle a lot of that in one place:
That’s easier to manage than stacking separate tools and hoping they don’t overlap.
I wouldn’t sell it as a magic answer to every failed Core Web Vitals report. No performance plugin can fully overcome weak hosting, a slow third-party vendor, unsafe dynamic-page caching, or a theme that outputs too much work. But once the diagnosis points to the normal WordPress performance stack, using one controlled layer is usually easier to manage than five tools all trying to optimize the same page.
Lab feedback can change quickly. Resize the LCP image, stop lazy loading the hero, reserve space for an embed, or remove a heavy script, and PageSpeed may show a difference within minutes.
The field assessment moves slower because it depends on real visitors over a rolling window. Search Console also needs enough fresh data before URL groups update. Busy sites may show movement in days. Low-traffic sites can take weeks.
So don’t keep changing settings every morning because Search Console still says failed. Use lab tests, manual mobile checks, and your change log for quick feedback. Then give field data time to catch up.
If I had your report open, this is the order I’d follow:
Start LCP work with server response and the measured first-screen element. Test INP by using the page with your hands and reducing JavaScript pressure carefully. Fix CLS by finding the thing that moves and reserving space for it.
That’s the practical way through a failed Core Web Vitals assessment in WordPress. Diagnose the failed experience first. Optimize second.
It means Google’s field data shows that at least one current Core Web Vitals metric failed for real visitors: LCP, INP, or CLS. WordPress is the platform, but the failure is about loading speed, interaction response, or layout stability.
The PageSpeed score comes from a Lighthouse lab test. The Core Web Vitals assessment comes from real-user field data when Google has enough of it. A clean test can look good while mobile visitors still wait too long, tap slow controls, or see the page move.
No. Not applicable usually means Google doesn’t have enough field data for the page or origin. It doesn’t mean the page passed, and it doesn’t mean the page failed.
AirLift can help when the failure points to normal WordPress performance work. Slow uncached pages, heavy images, first-screen CSS, and script handling are all in that territory. So are font loading, CDN delivery, page-builder output, and cache purges. It still needs to be used against the right diagnosis.
Core Web Vitals are used in Google’s page experience systems, so they can matter. They don’t override the need to be the best answer for the query. The better reason to fix them is that they describe what real visitors are dealing with.
A failed Core Web Vitals assessment in WordPress is easy to overreact to. Don’t.
Find the failed device, metric, and URL group. Then fix the matching experience: first-screen loading for LCP, real interactions for INP, and moving elements for CLS. A WordPress maintenance checklist is a good recurring check once the immediate fix is done. If AirLift is part of the stack and you’re unsure which setting is safe, AirLift support is the right escalation path.
Do the work in small passes, and you’ll avoid the classic WordPress trap: making the site look better to a test while making it worse for the people using it.
There is a very specific irritation in opening WordPress to make one small edit and then waiting on the dashboard like it’s thinking about whether you deserve access today. The…
Read

You usually do not go looking for Core Web Vitals on a calm afternoon. You find them because PageSpeed Insights shows a red warning, Search Console says a group of URLs is poor, or…
Read

You open PageSpeed Insights and see a score, Core Web Vitals, lab data, field data, and warnings about scripts, images, and server response. Then you test again and the score…
Read
Airlift works out what each page needs and applies it. Free to try on your own site.