

WordPress Object Caching: What It Is and When to Use It
Your homepage can feel fast while the parts that make money still feel slow. If you’re trying to speed up your website, it helps to understand that not every request behaves the…
Read

It is wise to run a WordPress performance audit before adjusting any other speed settings or installing another WordPress speed optimization plugin. That’s how you find which pages are slow, what kind of slowness you’re dealing with, and what you can change without breaking the forms, carts, and dashboards people rely on.
TL;DR: Audit the important URLs, read PageSpeed as evidence, find the slow layer, make one controlled fix, and retest the same URL. If the audit points to caching, images, front-end files, fonts, or delivery, AirLift can help with those WordPress performance layers after you know what you’re fixing.
The sloppy version of this audit starts with a tool.
Someone runs Google PageSpeed Insights, sees a long list of warnings, installs a speed plugin, turns on every setting with the word “optimize” in it, and hopes the graph turns green. Sometimes it does. Sometimes the homepage looks faster in a lab report while the mobile menu, lead form, cart, or cookie banner gets worse.
The better version starts with the page and the person trying to use it. Which page earns the visit? What feels slow there? Is the server late? Is the first image too heavy? Does the page look ready but ignore taps because JavaScript is still busy?
The point of the audit is to make the next safe fix obvious. Not the most dramatic fix. The next safe one.
The homepage belongs in the audit, but it shouldn’t be the whole audit.
On a lot of WordPress sites, the homepage is the cleanest page in the house. It gets designed carefully, cached well, and checked more often than anything else. Meanwhile, the slow page is a blog template with enormous featured images, a product gallery with heavy scripts, or a lead form carrying three marketing tools.
Pick a small set of URLs that represents how the site is actually used:
You don’t need fifty URLs. You need enough variety to catch template problems. A slow article page and a slow checkout page can both make the site feel bad, but they may need completely different fixes.
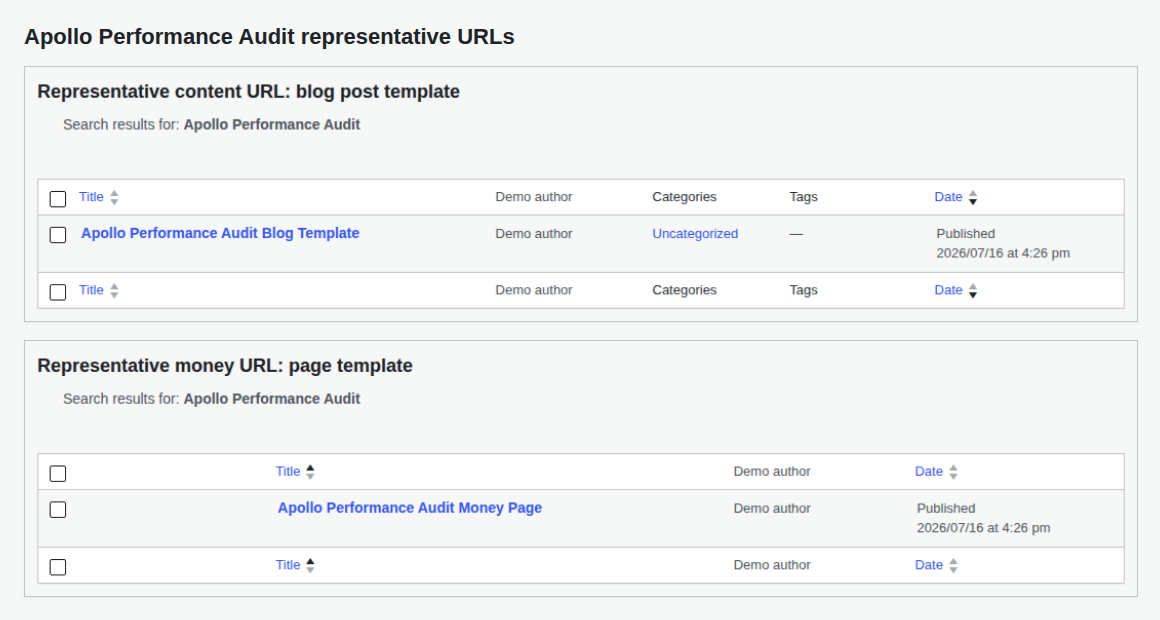
💡 Note: If you’re short on time, audit one money page and one content page first. That usually tells you whether you’re dealing with a site-wide setup problem or a template-specific one.
Open each page once like a normal visitor too. Use a private window. Use your phone. Logged-in WordPress sessions can load admin bars, editor scripts, notices, and other things visitors never see, so don’t diagnose the public experience while trying to figure out why your background tasks make the admin slow.
This feels like the paperwork part. I know. But when a cache rule breaks a form or a JavaScript setting makes the cart weird, the boring notes are what let you work backward without panic. Before changing settings, make a short audit snapshot:
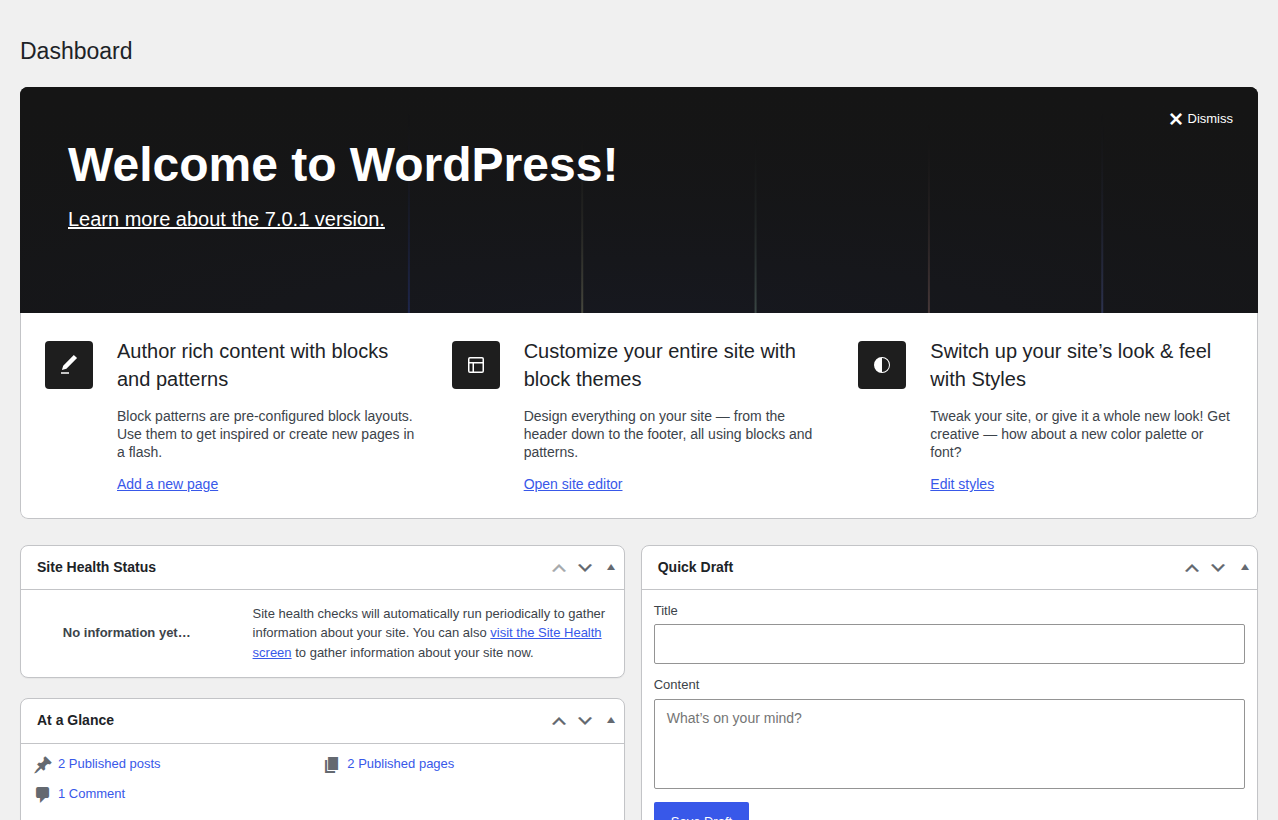
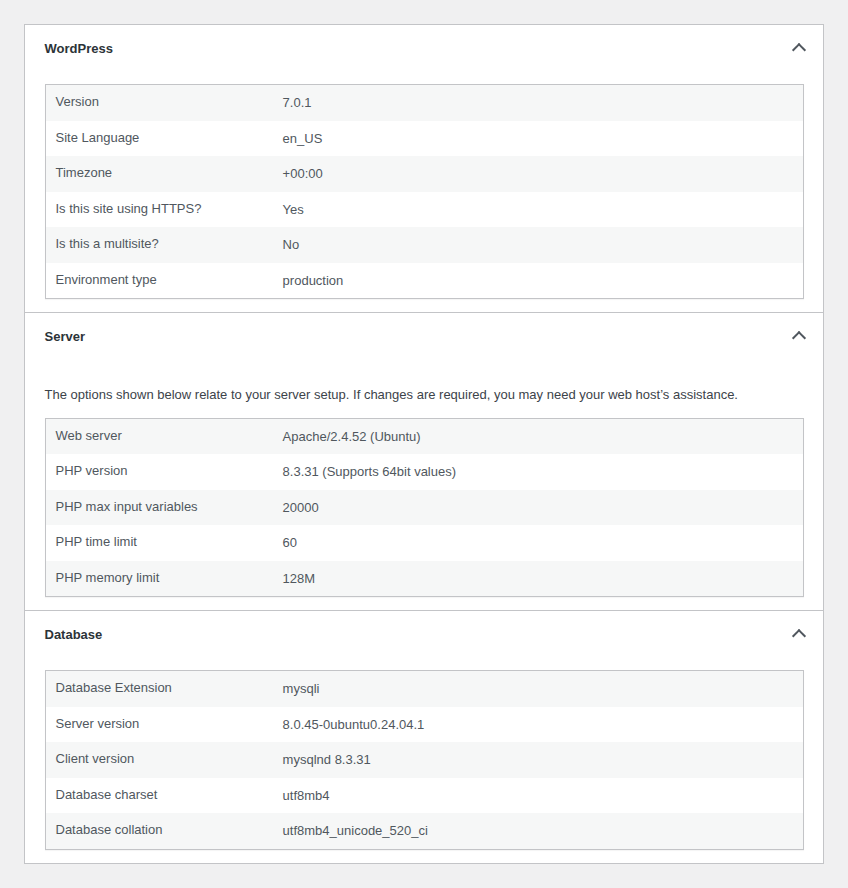
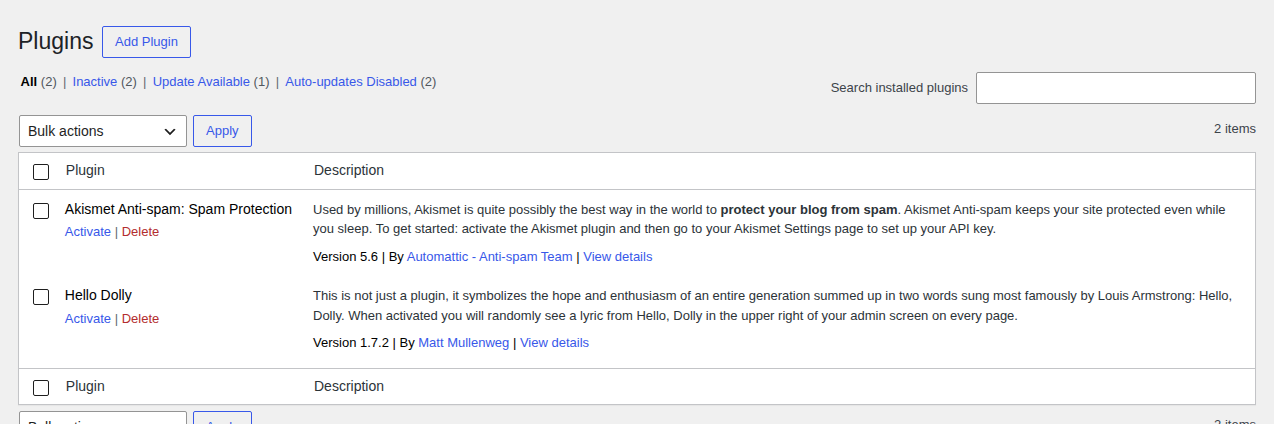
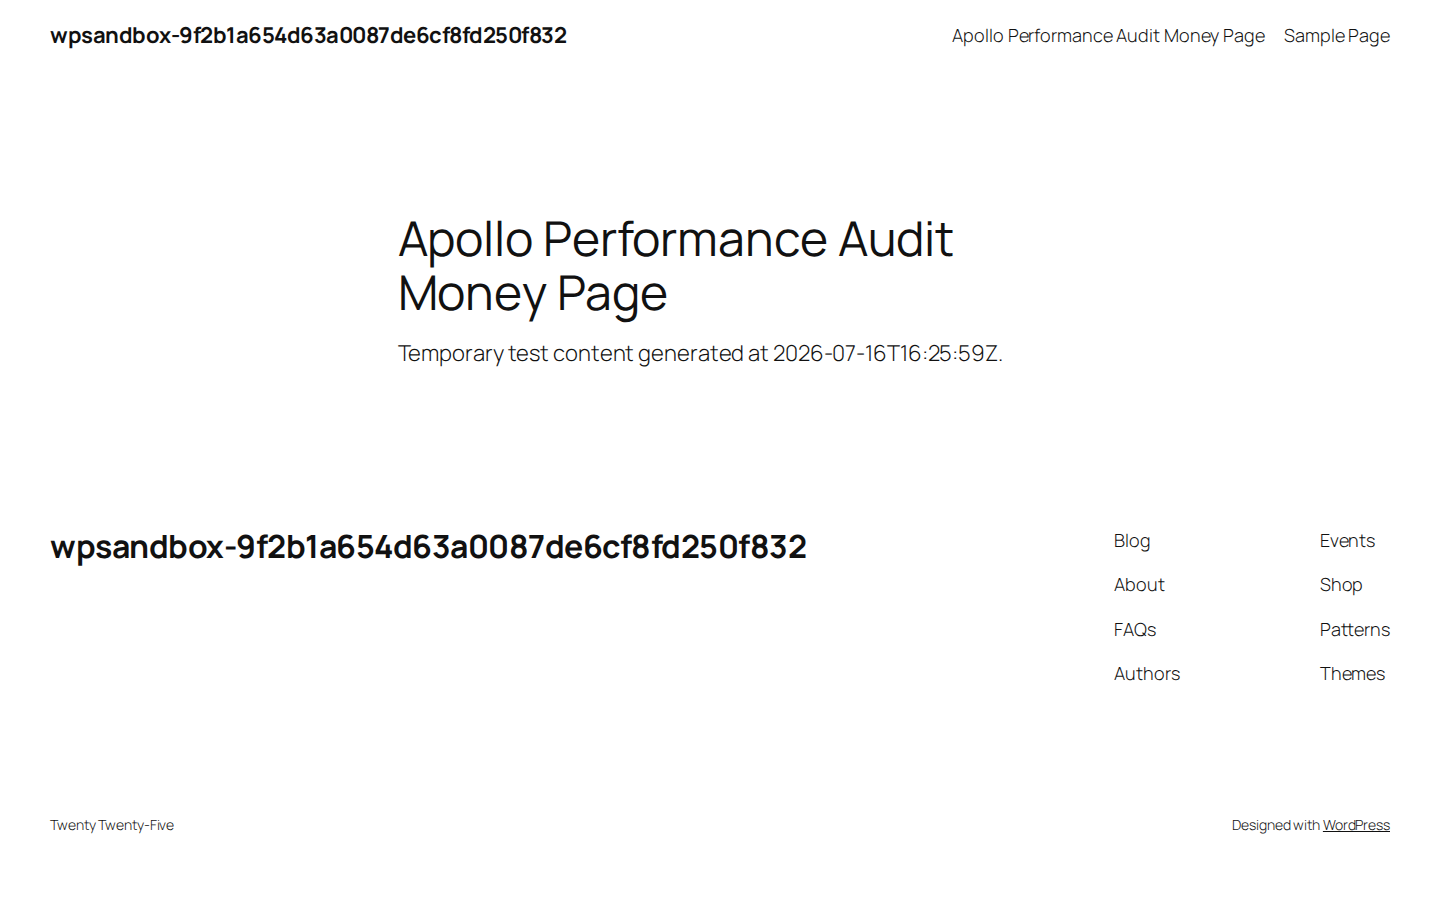
For this article, I checked a plain WordPress install where the inventory was almost comically quiet. It was running the current requested WordPress/PHP/MySQL stack, Twenty Twenty-Five as the active block theme, no active plugins, two inactive default plugins, the latest posts as the front page, and a couple of update notices. That’s useful as a baseline precisely because most real sites don’t look like that. They usually have a builder, a cookie banner, a few old marketing tags, and more than one tool trying to “help” with performance.
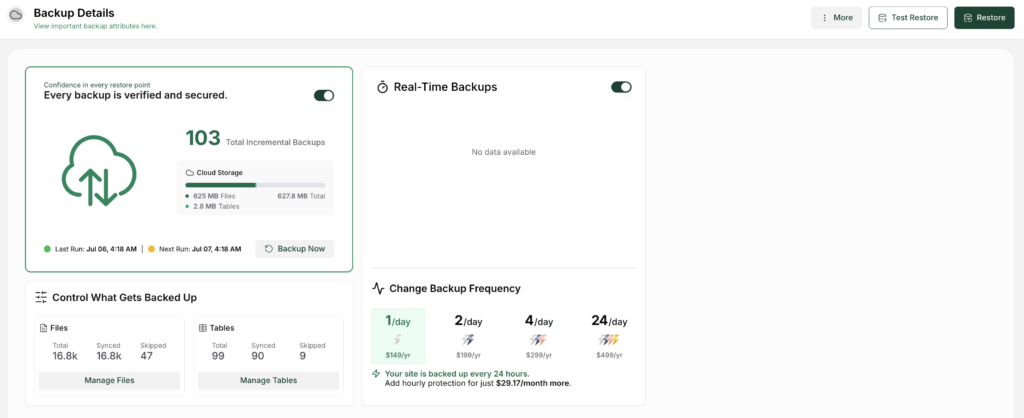
Create a restorable backup before changing anything. For payments, logins, memberships, bookings, lead forms, or analytics you rely on, use a staging website for changes that could alter behavior. A performance audit is allowed to find uncomfortable things. It shouldn’t create new ones.
Site Health is one place to collect the environment details before you start changing settings.
🛟 Note: Don’t treat inactive plugins as harmless by default. They shouldn’t load front-end assets, but they can still signal neglected maintenance, old experiments, or tools someone may reactivate later without understanding the performance cost.
PageSpeed Insights earns its place early in the audit because it separates two things people often mash together.
Field data is based on real Chrome user experience when Google has enough data for that URL or origin. Lab data comes from Lighthouse in a controlled test, which makes it useful for debugging and repeat checks. They answer different questions:
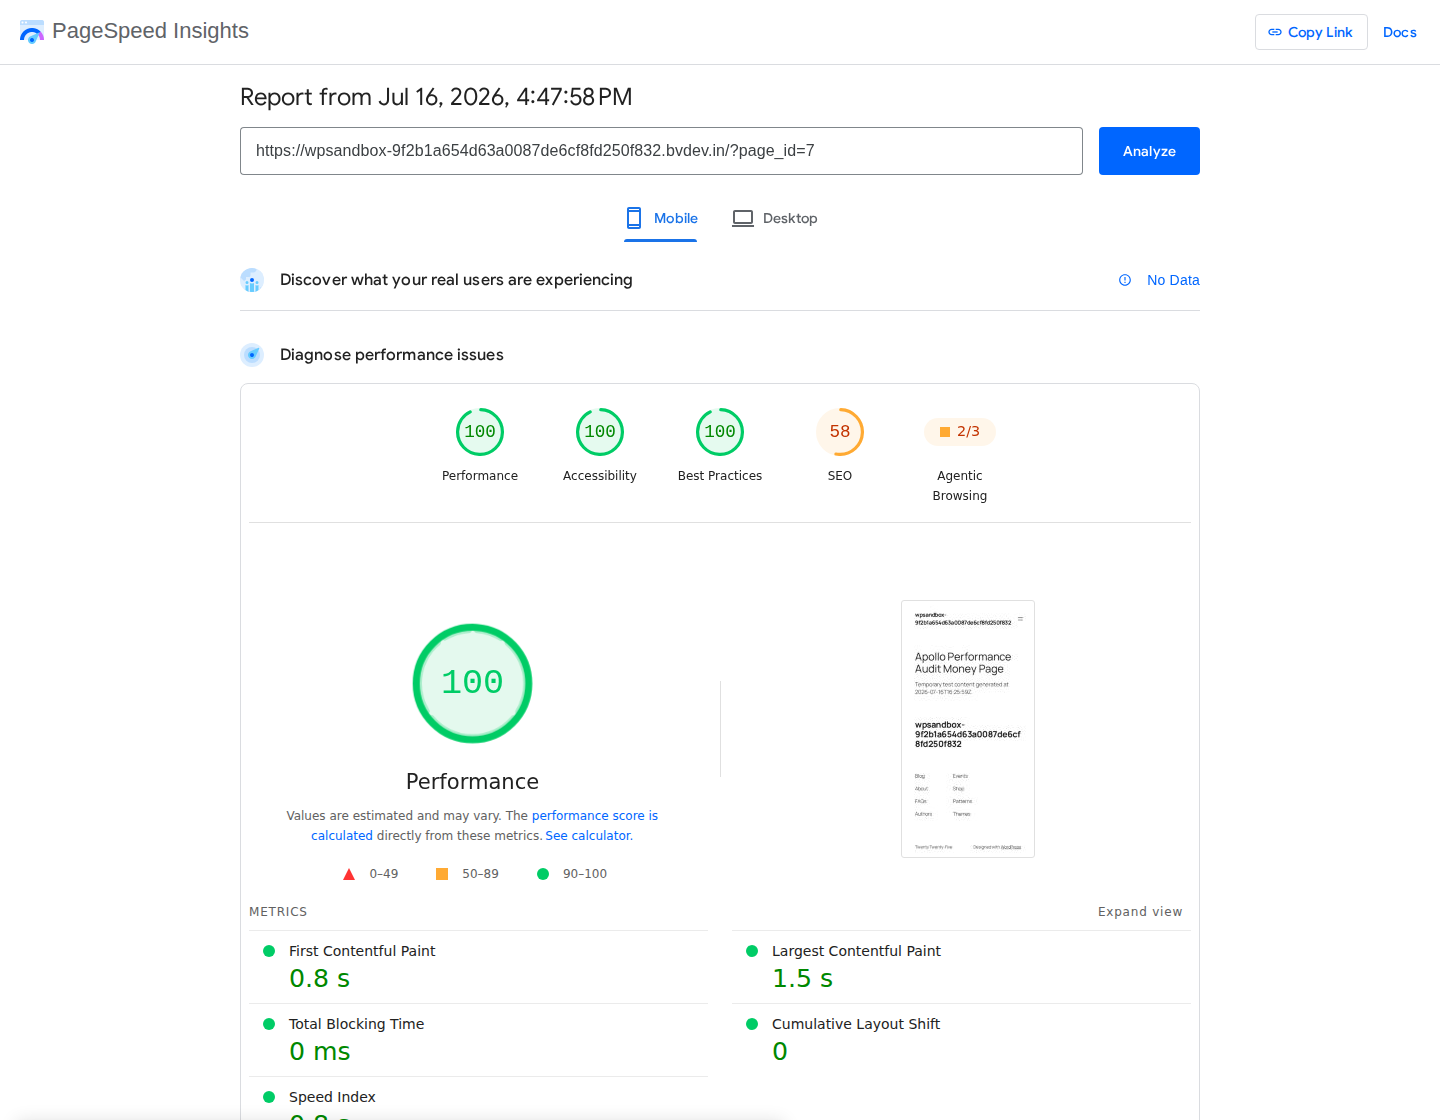
When reviewing your performance metrics via Google Core Web Vitals, keep the current thresholds close:
Google evaluates these at the 75th percentile for mobile and desktop separately. That’s a slightly awkward way of saying one lucky test run doesn’t matter much. You’re trying to make the important experience good for most visitors on the device type they use.
Don’t average mobile and desktop together when you’re deciding what to fix. A page can be fine on desktop and painful on mobile, especially if the first screen depends on a large image, a menu script, or a custom font.
📊 Note: If an older report talks about FID, translate that as old vocabulary. INP replaced FID as the Google Core Web Vital for interaction in 2024, so use INP when you’re making current decisions.
Most PageSpeed warnings are clues, not commands.
“Reduce server response time” might mean the page isn’t cached. It might mean the page can’t be cached safely. It might mean hosting is weak, database work is heavy, or a plugin is doing something expensive on every request.
“Largest Contentful Paint image was lazily loaded” usually points somewhere much more specific: the main image is being treated like an image halfway down the page.
I like to sort findings into four buckets:
| Bucket | What you’re looking for | Common WordPress cause |
|---|---|---|
| Server response | The HTML takes too long to arrive | cache miss, dynamic page, weak hosting, slow plugin/database work |
| First screen | The main content appears late | oversized hero image, lazy-loaded LCP image, render-blocking CSS/JS, font delay |
| Interaction | Taps and clicks feel sticky | heavy JavaScript, menus, filters, popups, cart behavior, third-party scripts |
| Stability | The page jumps while loading | missing image dimensions, ads, embeds, banners, fonts, plugin-injected UI |
Once you know the bucket, the next move gets less fuzzy. Stop asking how to improve the score and start asking what is making this page slow for this visitor.
🧭 Note: If one page has problems in every bucket, don’t try to fix all of them in one pass. Start with the problem the visitor feels first. Usually that’s slow HTML, a late first screen, a sticky tap, or a visible jump.
Caching matters for WordPress because public pages get requested again and again. When the server can hand back a ready version of the page, visitors don’t have to wait while WordPress assembles it from the theme, plugins, database, and content.
But caching is also where people get overconfident.
A public article, a checkout page, a logged-in dashboard, and a search results page shouldn’t all be treated the same way. Public articles can usually be cached aggressively. Checkout, search, account, and logged-in pages need more care because the wrong cache rule can show stale or personalized content.
For each important URL, check:
That last question catches a surprising number of messy sites. If the host, CDN, theme, and two plugins are all trying to delay JavaScript or change CSS delivery, nobody really owns the result. Caching can hide server work on public pages. It won’t shrink a 3000px image, remove a widget that loads everywhere, fix a lazy-loaded hero image, or make unsafe dynamic pages cacheable.
For sites where people commonly move from one article or service page to the next, navigation prefetching is worth testing after the basic cache rules are sane.
⚠️ Note: Be careful with “delay all JavaScript” and similar one-click settings. They can make Lighthouse happier while making a menu, consent banner, form validation, cart update, or analytics event less reliable.
For many WordPress pages, LCP isn’t mysterious. It’s usually visible before you scroll. Often it’s the biggest thing in the first viewport: a hero image, a product photo, or the main heading area. Open the page, run the test, and identify the LCP element before you change anything else.
When PageSpeed marks an image as the main LCP item, check:
Lazy loading belongs on images the visitor hasn’t reached yet. The first-screen image should not be waiting its turn.
Fonts can cause their own mess here. If a custom font delays visible text or swaps late enough to move the page, the reader doesn’t care that the design system is technically consistent. They see a page that hesitates. If fonts are part of the delay, reducing font file size can be cleaner than removing the typeface entirely.
🖼️ Note: The right LCP fix is not always “compress the image more.” Sometimes the file is already reasonable, but it’s requested too late because of lazy loading, CSS background-image behavior, a slider, or render-blocking files ahead of it.
Fix the first screen like an editor as much as a technician: what does the visitor need to see first, and what is making that wait?
Plugin count is a weak metric. Ten careful plugins can be fine. Three heavy ones can make everything drag. For the page you’re auditing, look at what each plugin actually does:
Don’t disable the plugins that handle payments, logins, protection, tracking, or forms on a live site just to see what happens. Use a staging copy when the workflow matters. If a live test is truly unavoidable, change one thing, check the workflow right away, and keep the rollback path open.
Themes and builders belong in this pass too. A page can look simple and still ship bulky CSS, extra scripts, custom fonts, and layout wrappers. Pretty pages can be heavy. Ugly pages can be heavy too, which feels unfair, but here we are.
🔌 Note: When you suspect a plugin, look for where its files load, not just whether the plugin is active. A form plugin loading assets on the contact page is normal. The same assets loading on every blog post is where the audit gets interesting.
Third-party scripts are usually added for a reason. The problem is that the reason expires and the script stays.
A chat widget may belong on pricing and contact pages. It probably doesn’t belong on every article. A heatmap tool may be useful during an experiment and pointless six months later. A review widget may help on a product page and do nothing on an informational post.
Make a simple inventory:
Then ask the question: does this need to load here? If a consent tool or analytics tag relies on third party cookies, note where it loads before you decide whether the performance cost belongs on every page.
You don’t have to win every internal debate during the audit. Marketing, sales, analytics, and support may all have legitimate reasons for the tools they added. Your job is to show the cost clearly enough that the next decision is made with eyes open.
🎯 Note: Don’t remove measurement scripts blindly. If a campaign is running, agree on what must stay, what can be limited to certain URLs, and what can be paused after the campaign ends. Performance work gets easier when it doesn’t look like you’re quietly breaking reporting.
Tools won’t catch everything.
Open the page on a phone and use it. Tap the menu. Search. Open filters. Accept or reject the cookie banner. Submit a test form on a safe copy. For ecommerce, add a product to the cart and walk up to the payment step without placing a real order.
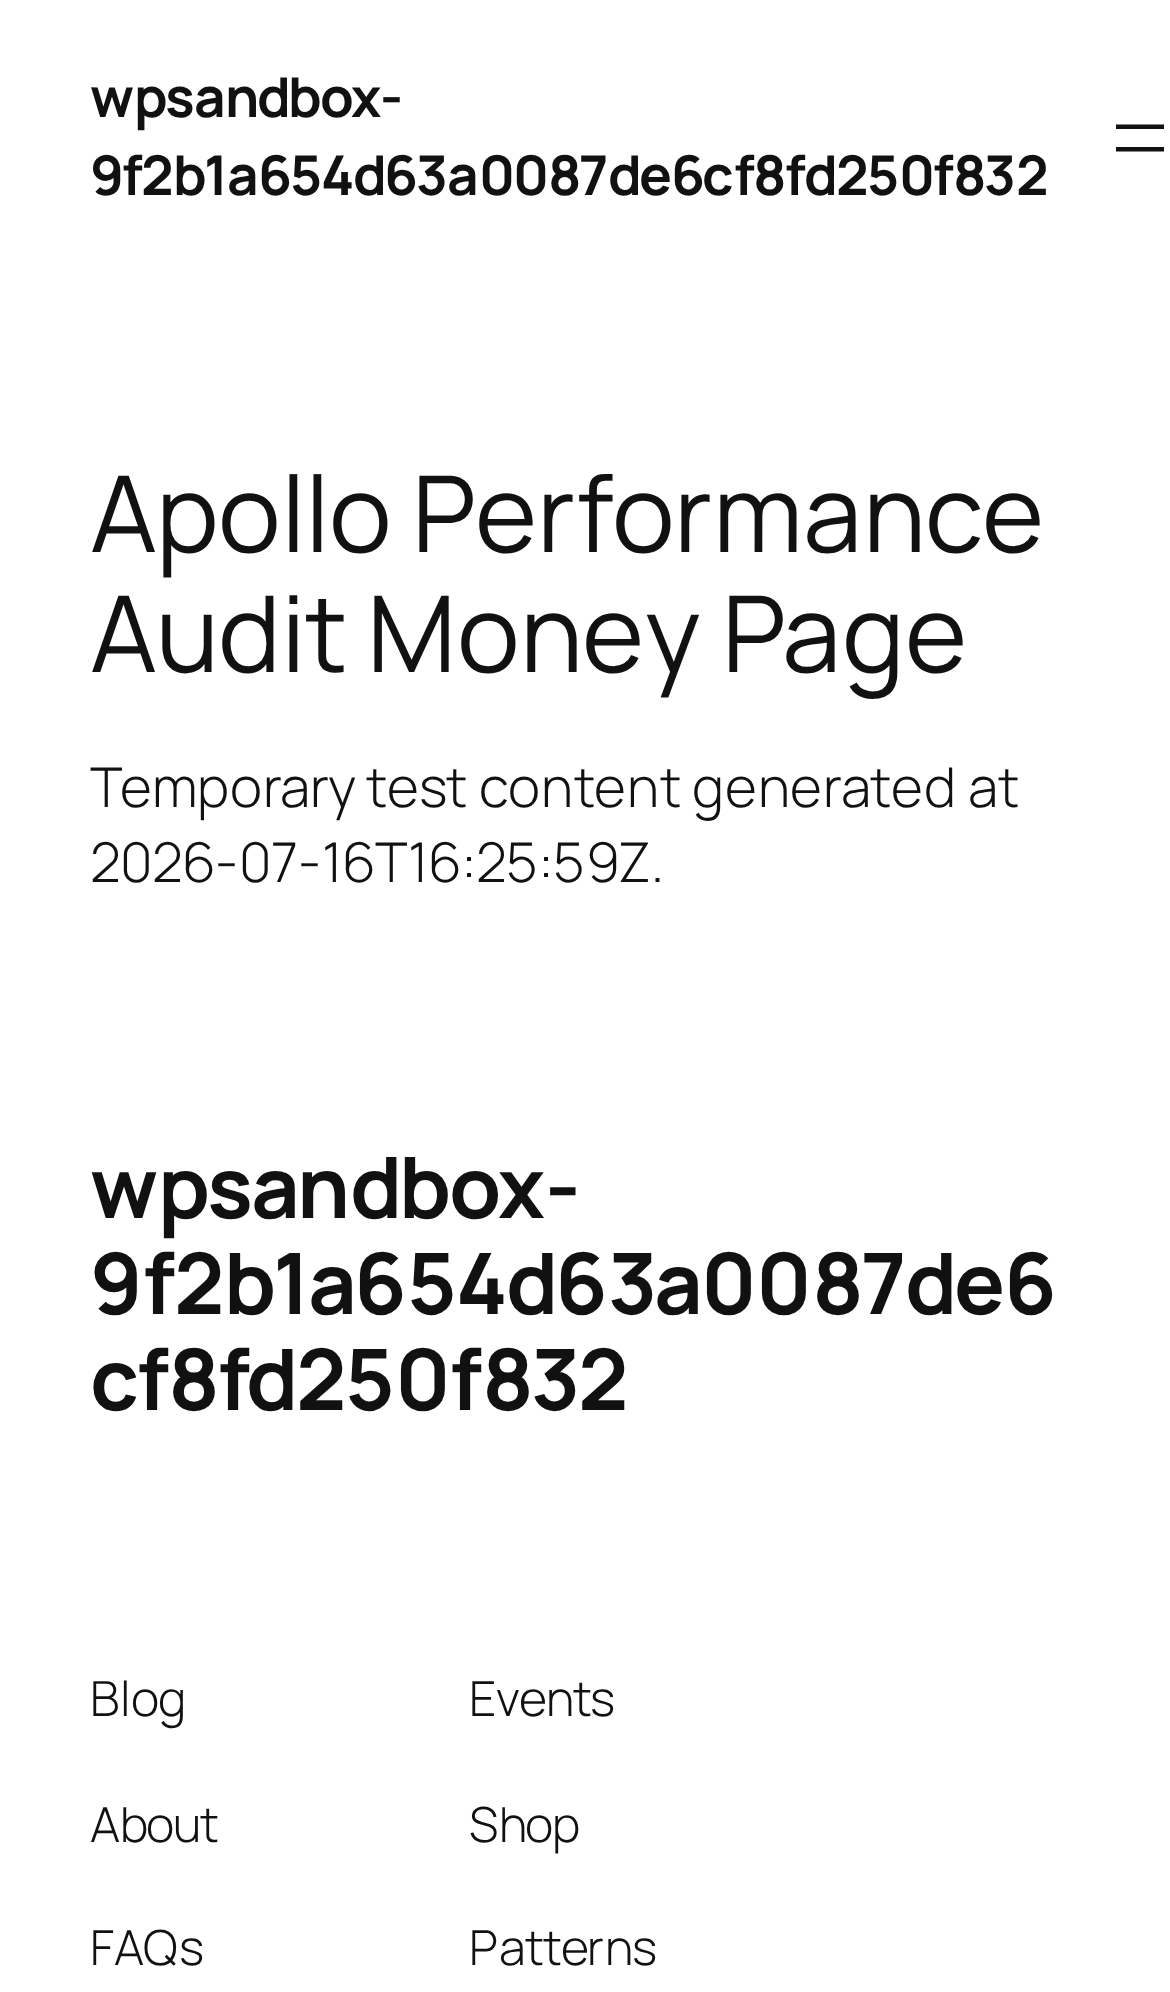
Write down what feels wrong in plain language:
Those notes are not less serious because they aren’t phrased like a metric. They often explain why the metric matters. If you tap twice because the first tap didn’t seem to work, that’s the problem. Whether the report calls it INP, main-thread work, or long JavaScript tasks is the diagnosis step after the frustration is already real.
📱 Note: Test with the cookie banner visible at least once. I’ve seen otherwise clean pages become awkward because the consent tool shifts the layout, blocks a button, or waits on a third-party script before the page feels usable.
The end of a WordPress performance audit should not be a giant wishlist. It should be a short, defensive order of work designed to speed up site loading times where it matters most. I would usually prioritize like this:
That last one is where people waste money. A CDN can help when geography, asset delivery, bandwidth, or traffic spikes are part of what you found. It won’t repair an oversized hero image, weak plugin behavior, heavy JavaScript, or slow database work by itself.
After you choose a fix, make one change and retest the same URL on the same kind of device, using the same workflow. If something breaks, roll that change back before adding the next idea. Stacked fixes feel efficient right up until checkout breaks and nobody knows which switch did it.

🧪 Note: Keep a tiny change log during the audit. For each test, record what changed and whether it helped. It sounds fussy until two people are editing the same site and yesterday’s “quick fix” becomes today’s mystery.
Once the audit shows that the problem lives in common WordPress performance layers, that’s when a tool like AirLift makes sense.
AirLift is built for the repeat work a lot of audits uncover: page caching, CDN-backed delivery, image compression and resizing, CSS and JavaScript improvements, font handling, builder-page support, Critical CSS, and automatic CSS re-optimization when the site changes later.
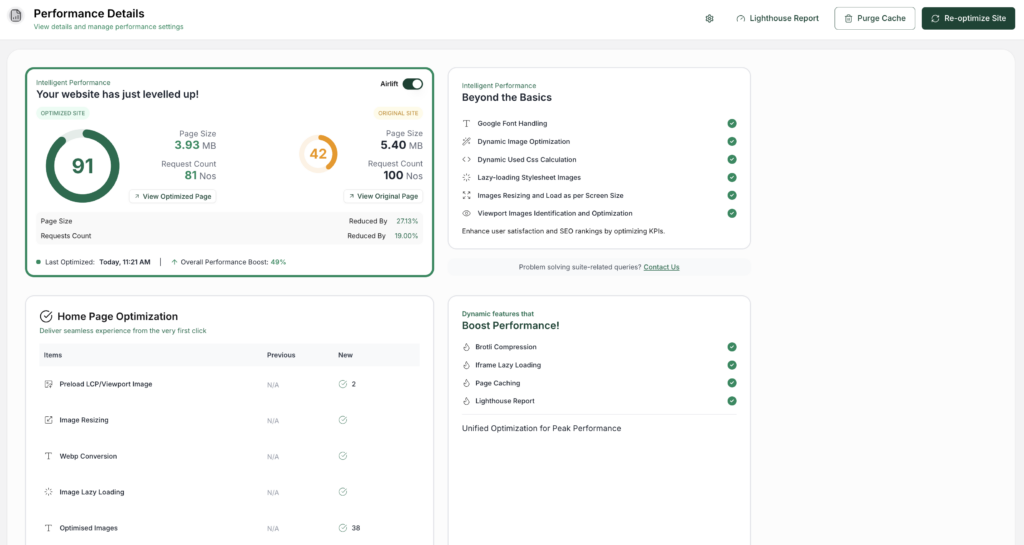
I wouldn’t use AirLift as a replacement for the audit. I’d use it after the audit has told me what kind of problem I’m solving.
If checkout is slow because it needs uncached server work, treat that flow carefully. If a form or menu is fragile, test it after enabling optimization. But when the audit points to cacheable pages, heavy images, render-blocking files, or font delays, AirLift fits the kind of work the audit just surfaced.
This is the right moment for automation: after you’ve identified the repeatable performance layer. Let the tool handle the repeat work, but keep the audit notes nearby so you know what to verify afterward. If that sounds like the right next step, check AirLift pricing or contact AirLift support before changing live workflows.
✅ Note: AirLift should make the repeatable fixes easier, not make you stop checking important workflows. After enabling performance changes, test checkout, forms, login, and booking before you call the work done.
Run a full audit around the moments that change the site’s weight:
For an active business site, I’d also do a lighter monthly check on the money pages. Not a dramatic all-day investigation. Just enough to catch the slow creep: a new script here, a heavier image there, a plugin update that changed front-end output.Utilizing AirLift’s automated features alongside a structured wordpress performance checklist will keep those recurring speed checks running seamlessly alongside your routine backups, updates, and security reviews.
WordPress performance usually gets worse gradually. The audit keeps the site honest.
A WordPress performance audit is a structured check of the WordPress pieces that shape speed: the page being tested, the server response, the theme and plugins, the assets loaded in the browser, caching, and Core Web Vitals. A useful audit doesn’t stop at “your score is 62.” It explains which part of the page is slow and what you’d change first.
Pick a few representative URLs, record the site’s WordPress/PHP/theme/plugin setup, test those URLs in PageSpeed Insights, separate field data from lab data, and group the findings by server response, first-screen loading, interaction, and layout stability. Then make one controlled change and retest the same URL. Once you flip a handful of switches together, you may get a different score, but you won’t know which switch mattered.
Start with one money page and one content page. That might be a product page, a booking page, or a lead form, plus a high-traffic post that uses your normal article template. Add the homepage, but don’t let it be the only URL you test. It’s often cleaner than the pages people actually complain about.
Caching can speed up reusable public pages, but it can’t fix every kind of slowness. Even from cache, a page may download a ridiculous first image, wait on JavaScript, shift around as late elements appear, or load outside scripts that don’t belong on that URL. Dynamic pages such as checkout, search, account areas, and logged-in views also need more careful handling.
Run a full audit after redesigns, theme changes, builder changes, major plugin additions, new templates, big campaigns, or Core Web Vitals warnings. For a business site, do a lighter monthly check on the pages tied to leads, sales, and high traffic. That’s usually enough to catch performance creep before it turns into a larger cleanup project.
A good WordPress performance audit leaves you with a short decision, not a long wishlist. You know which important page is slow, what kind of slowness it has, which fix has the best impact with the least risk, and whether the same page improved after the change.
If you have that, you’re no longer guessing. You’re working from evidence, and that’s when performance work gets calmer.
Not easier, necessarily. But calmer. And on a WordPress site with real traffic, forms, customers, and revenue attached to it, calmer is worth a lot. For routine care, see WP Remote’s guide to WordPress maintenance.
Your homepage can feel fast while the parts that make money still feel slow. If you’re trying to speed up your website, it helps to understand that not every request behaves the…
Read

Your WordPress site feels slow. Speed tests look bad, and every guide offers a different fix: caching, image optimization, better hosting, or installing plugins. Speed work gets…
Read

Is your WordPress website loading slowly, but you are not sure what is causing the problem? Changing plugins, hosting, themes, or cache settings without clear evidence can waste…
Read
Airlift works out what each page needs and applies it. Free to try on your own site.