Website Performance Metrics: What To Track and How To Improve
You open PageSpeed Insights and see a score, Core Web Vitals, lab data, field data, and warnings about scripts, images, and server response. Then you test again and the score changes.
That is usually when website performance metrics stop feeling useful and start feeling like a report card with moving rules.
Here is the practical answer: website performance metrics show whether your site loads useful content quickly, stays stable, responds to clicks and taps, and works reliably for real visitors. Start with Core Web Vitals, then use the other numbers to find the cause.
TL;DR: Track LCP, INP, and CLS first because they describe what visitors feel. Use FCP, TTFB, Speed Index, TBT, page size, request count, uptime, and errors to decide what to fix next.
The score is not the goal. A page that loads the main content fast, does not jump around, and lets people use menus, forms, checkout, and buttons without delay is the goal.
What website performance metrics tell you
Website performance metrics measure the parts of speed that visitors can feel. They help you answer simple questions:
Does the main content appear quickly?
Does the page respond when someone taps or clicks?
Does the layout move after the visitor starts reading?
Is the server slow before the page even starts loading?
Is the page heavy because of images, fonts, scripts, ads, or plugins?
Are downtime or errors stopping people from using the site?
For WordPress sites, these problems are usually practical. A large hero image can slow a landing page. A plugin script can delay a mobile menu. An ad slot can push text down. A checkout page can look loaded but still feel stuck because JavaScript is blocking the browser.
The metric is the symptom. It is not always the diagnosis.
Start with the metrics that affect visitors most
The fastest way to reduce confusion is to rank the metrics by how close they are to the visitor’s experience.
Metric
What it measures
Good target
First place to look
LCP
Main content load
2.5s or less
Hero image, cache, server response, render-blocking files
INP
Response after interaction
200ms or less
JavaScript, plugin scripts, third-party tags
CLS
Unexpected layout movement
0.1 or less
Image sizes, ads, embeds, fonts, banners
TTFB
Server response start
800ms or less
Cache misses, hosting, database work, CDN setup
Page weight
Total download size
Smaller is better
Images, fonts, unused CSS/JS, widgets
If you only remember one rule, use this one: Core Web Vitals tell you what visitors feel. Supporting metrics tell you where to investigate.
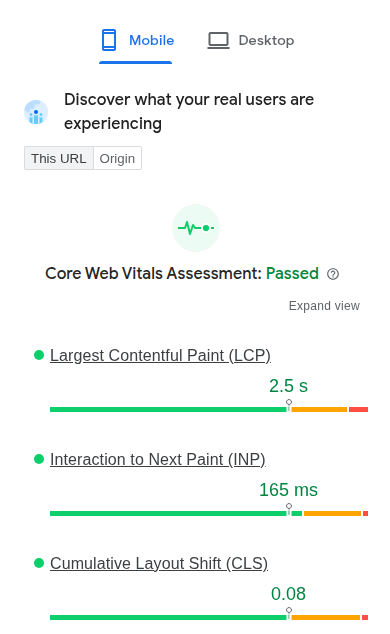
LCP maps to the complaint, “The page takes too long to show the main thing.” INP maps to, “I tapped and nothing happened.” CLS maps to, “The page moved while I was trying to read or click.”
FCP, Speed Index, TBT, request count, uptime, and error rate still matter. They are best used as supporting evidence. Do not give every number equal weight, or you will spend all day fixing the wrong thing.
Supporting Performance Metrics
Core Web Vitals are the most important performance metrics, but they are not the only numbers you will encounter in tools such as PageSpeed Insights, Lighthouse, GTmetrix, and WebPageTest.
The metrics below are best used as supporting evidence. They help explain why Core Web Vitals are struggling and point you toward the underlying cause.
Largest Contentful Paint (LCP)
LCP measures how long it takes for the largest visible element on the page to appear. Depending on the page, this may be a hero image, featured image, product image, or large block of text.
Visitors often notice poor LCP as a page that feels slow to load, even when other elements have already appeared.
High LCP commonly points to:
Large images
Slow server response
Render-blocking CSS or JavaScript
Weak caching
Missing CDN delivery
Because LCP reflects when visitors can see the main content, it is often the most important loading metric to investigate.
Interaction to Next Paint (INP)
INP measures how quickly the page responds after a visitor clicks, taps, or types. Visitors experience poor INP when menus, forms, search filters, or buttons feel delayed or unresponsive. High INP commonly points to:
Heavy JavaScript execution
Plugin scripts
Third-party tags
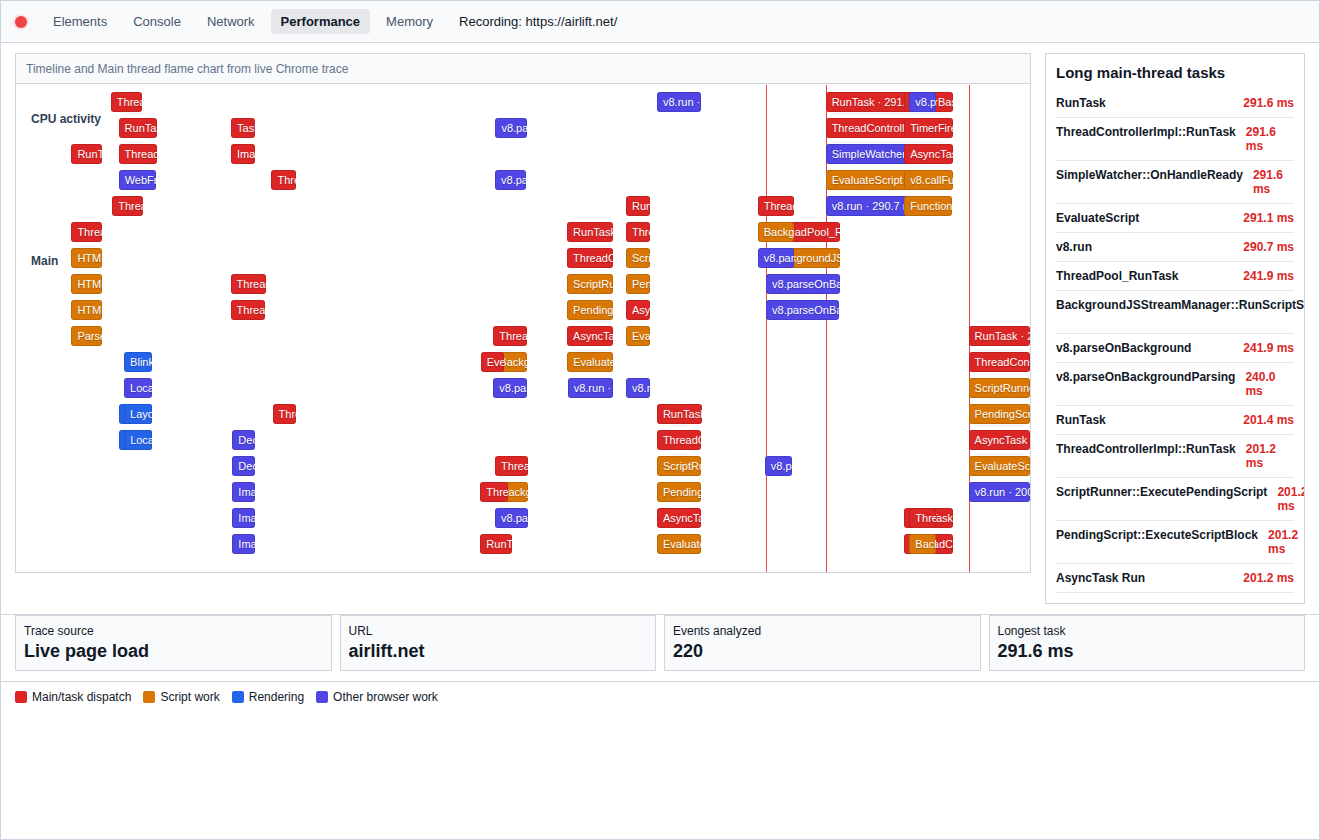
Long-running browser tasks
INP is one of the best indicators of how responsive a page feels during real use.
Cumulative Layout Shift (CLS)
CLS measures how much the page layout moves unexpectedly while loading. Visitors often notice poor CLS when content shifts while they are reading, scrolling, or trying to click a button. High CLS commonly points to:
Images without dimensions
Ad placements
Embedded content
Font swapping
Dynamic banners and popups
CLS is particularly useful for identifying visual stability issues that make a page feel unreliable.
First Contentful Paint (FCP)
FCP measures how long it takes before visitors see the first piece of content on the screen. Visitors may see text, a logo, or an image appear, even though the page is not fully loaded. High FCP commonly points to:
Slow server response
Render-blocking resources
Large critical assets
FCP is best used as a supporting metric alongside LCP rather than as a primary optimization target.
Time to First Byte (TTFB)
TTFB measures how long the browser waits before the server starts sending the page. Visitors do not see TTFB directly, but a high value delays everything that follows. High TTFB commonly points to:
Cache misses
Slow hosting
Database overhead
Backend processing delays
Server configuration issues
TTFB is particularly useful for identifying server-side bottlenecks.
Speed Index
Speed Index measures how quickly visible parts of the page appear during loading. Unlike LCP, which focuses on the largest element, Speed Index looks at the overall visual progress of the page. A poor Speed Index commonly points to:
Slow rendering
Heavy above-the-fold content
Render-blocking resources
Excessive page complexity
Speed Index is most useful as supporting evidence when diagnosing loading issues.
Page Weight
Page weight measures the total amount of data visitors must download before a page can fully load. Large pages typically take longer to load, especially on slower networks and mobile devices. High page weight commonly points to:
Oversized images
Video content
Large font files
Unused CSS
Unused JavaScript
Reducing page weight often improves several performance metrics at the same time.
Request Count
Request count measures how many individual files the browser must download while loading a page. Each image, script, stylesheet, font, and third-party resource creates another request. High request counts commonly point to:
Too many plugins
Multiple font files
Third-party scripts
Unoptimized themes
Request count is useful for understanding how much work the browser must do before a page becomes usable.
Uptime
Uptime measures how often a website is available to visitors. Unlike loading metrics, uptime focuses on availability rather than speed. Poor uptime commonly points to:
Hosting outages
Resource limitations
Server failures
Infrastructure issues
Even a fast website provides a poor experience when visitors cannot access it consistently.
Error Rate
Error rate measures how often visitors encounter failures while using the site. These may include broken pages, server errors, timeouts, failed checkouts, or form submission issues. High error rates commonly points to:
Plugin conflicts
Server issues
Broken links
Configuration problems
Error rate is particularly useful for measuring reliability because a fast page is still a poor experience if it frequently fails.
How performance metrics relate to each other
Performance metrics rarely fail in isolation.
Metric suffering
Common underlying causes
LCP
Slow TTFB, large images, render-blocking CSS or JavaScript
INP
Heavy JavaScript, plugin scripts, third-party tags
CLS
Missing dimensions, ads, embeds, font swapping
FCP
Slow server response, blocking CSS, large critical assets
Understanding these relationships helps you fix the cause rather than chasing symptoms.
Check lab data and field data
Two tools can show different numbers for the same page. Even one tool can change between runs. That does not mean the report is useless.
Lab data is a controlled test. It helps you debug, compare before and after changes, and see what happens under a specific device and network setup.
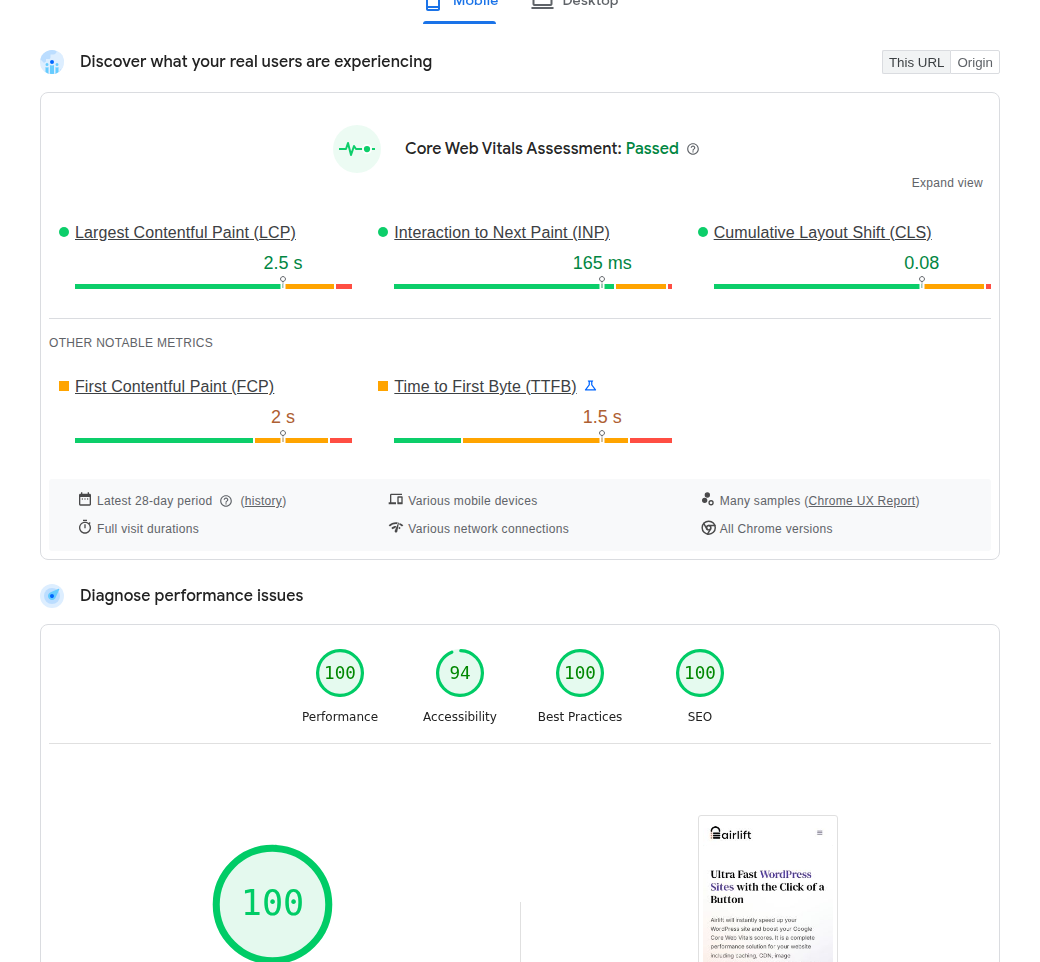
Field data comes from real users when enough data exists. In PageSpeed Insights, this comes from the Chrome User Experience Report. It reflects a trailing 28-day period and uses the 75th percentile, which means it pays attention to the slower side of normal visitor experience.
This difference matters. A page can look fine in a lab test but still be slow for real visitors on weaker phones, slower networks, or different page variants. A new page may also have no field data yet, so you may see origin-level data or no field data. Use lab data to debug. Use field data to understand what visitors have been experiencing over time.
Use the right tool
Do not open every performance tool at once. Pick the tool that answers the question in front of you.
Tool
Use it for
Watch out for
PageSpeed Insights
First Core Web Vitals and Lighthouse check
Scores can vary between runs
Search Console
Real-user issue groups by page type
It shows patterns, not exact causes
Chrome DevTools
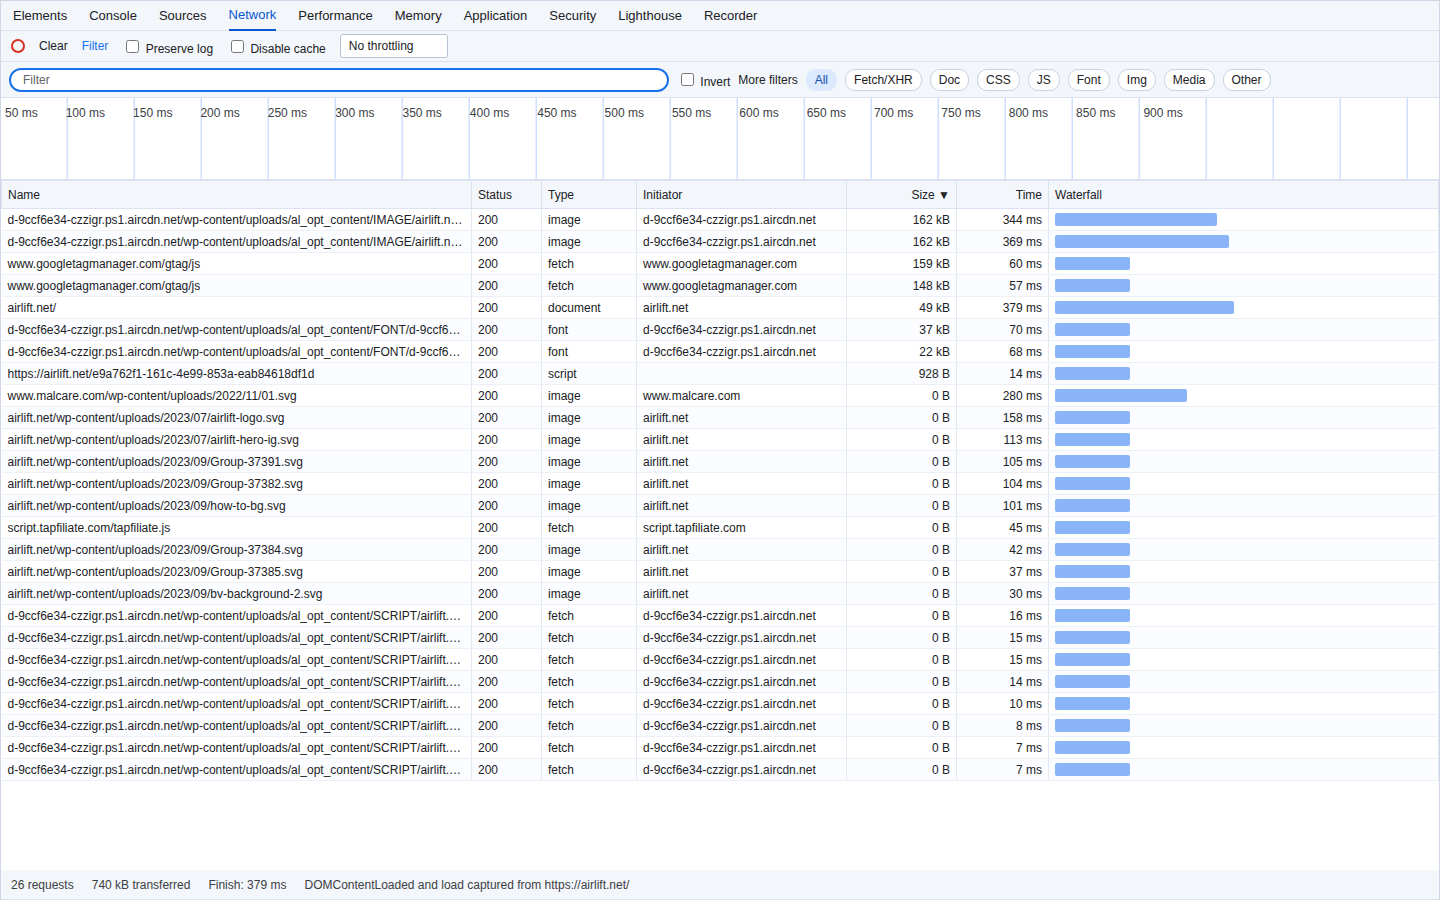
Network, scripts, rendering, and local debugging
Results depend on your setup
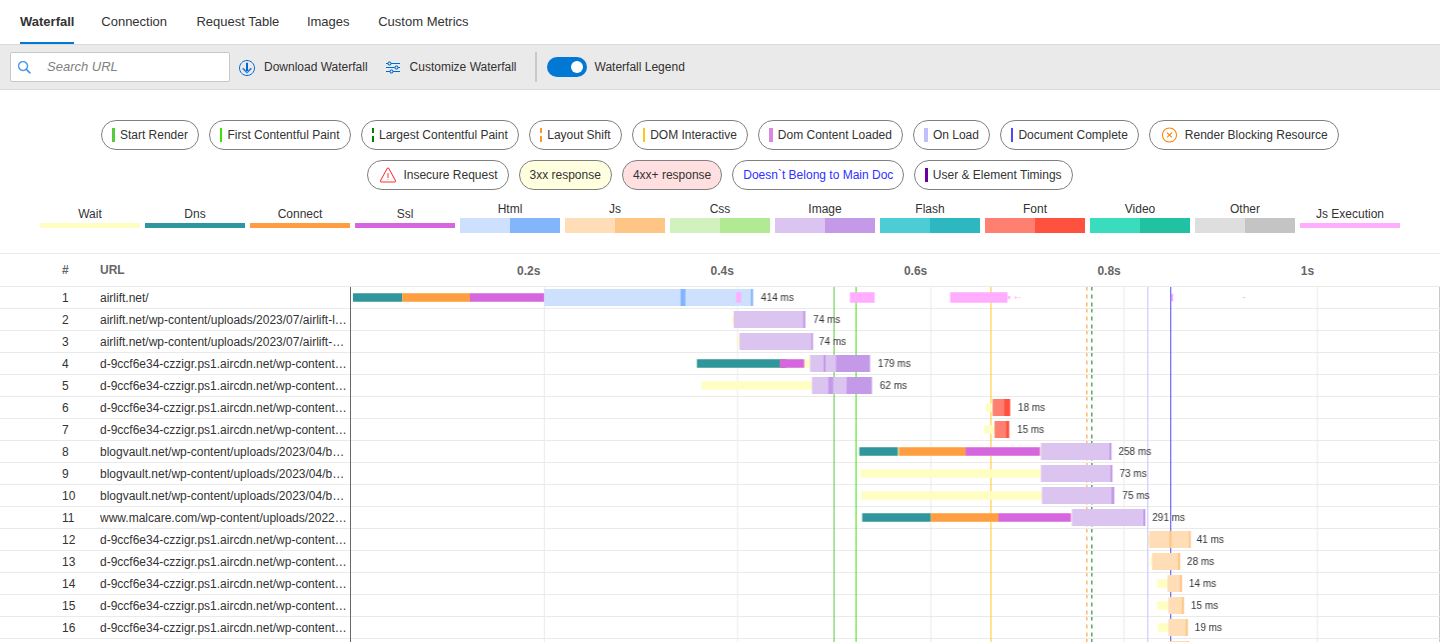
GTmetrix or WebPageTest
Waterfalls, filmstrips, locations, repeat tests
Easy to over-read minor details
RUM tools
Ongoing real-user monitoring
Worth it only if someone acts on the data
PageSpeed Insights is the best first stop for most site owners. Search Console helps you see whether a problem affects one page or a whole template. DevTools, GTmetrix, and WebPageTest help you find the bottleneck.
For a revenue-critical site, real-user monitoring can be worth the cost. A slow checkout or form does not just hurt a report. It quietly costs money.
Read the results
The most important metric is not always the one with the scariest color. It is the one blocking the page’s job.
Start with one important page: the homepage, a landing page, a top blog post, a product page, checkout, or a form page. Test mobile and desktop separately because mobile is where many WordPress problems show up first. Before changing anything, record:
Page URL
Tool and test date
Mobile and desktop results
LCP, INP, CLS, and TTFB
The largest visible issue in plain language
Then turn the weak metric into one next action.
If this is poor
First action
Verify by
LCP
Optimize the main image and check cache/TTFB
Retest and watch when main content appears
INP
Reduce heavy scripts and test key interactions
Try menus, forms, filters, cart, checkout
CLS
Reserve space for images, ads, embeds, and banners
Fix one major bottleneck at a time. If you change cache rules, image compression, script loading, font loading, and lazy loading in one pass, you may get a better score but not know what helped. Use optimization controls so each setting can be tested against the metric it is meant to improve.
Worse, you may break a menu, checkout step, tracking tag, or form. Do not trade a working site for a prettier report.
What poor metrics usually mean on WordPress
WordPress performance problems often come from layers that stack up quietly: theme files, plugins, images, fonts, embeds, ad scripts, analytics tags, hosting, cache behavior, and database work.
The visible problem is one red metric. The hidden problem is usually a chain. If unexplained slowness appears with redirects, spam, or strange files, rule out a hacked WordPress site before treating it as a normal speed issue.
Poor LCP
Poor LCP means the visitor waits too long for the main content. On a landing page, that may be a hero image. On a blog post, it may be the featured image. On a product page, it may be the main product image.
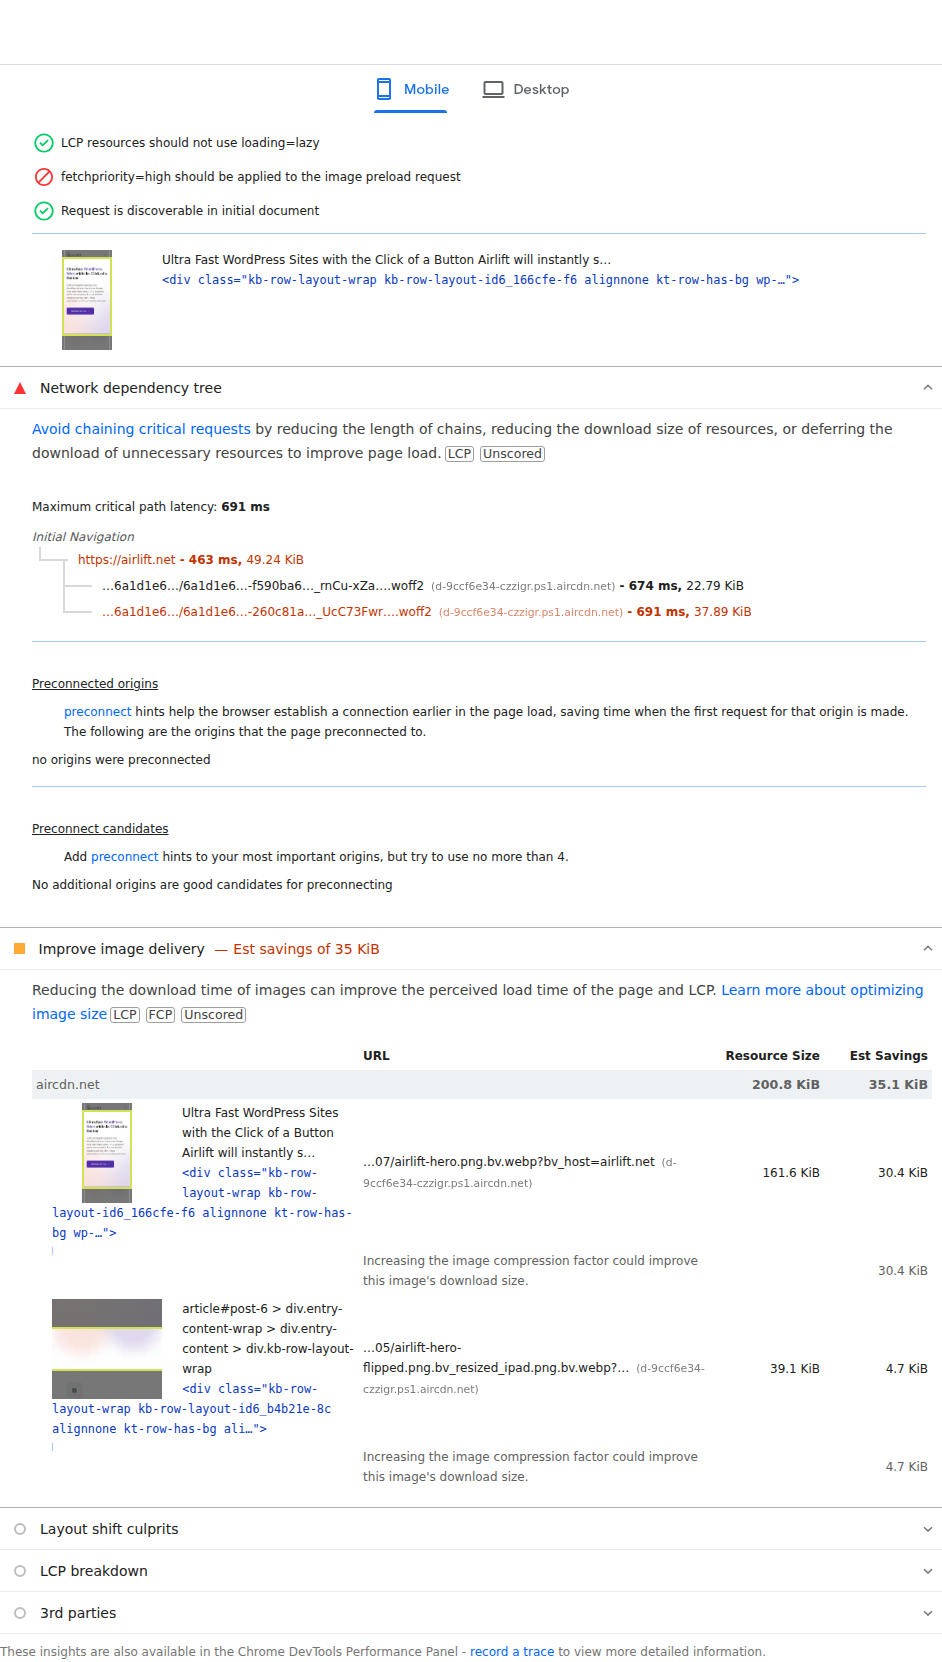
Start by asking: what is the largest useful thing the visitor needs first, and why is it late? Common causes include oversized images, slow server response, render-blocking CSS or JavaScript, weak caching, no CDN, and heavy above-the-fold layouts.
Poor INP
Poor INP means the page is slow after a visitor does something. This hurts menus, search filters, forms, add-to-cart buttons, checkout steps, and page-builder elements. The usual causes are heavy JavaScript, long main-thread tasks, too many plugin scripts, and third-party tags.
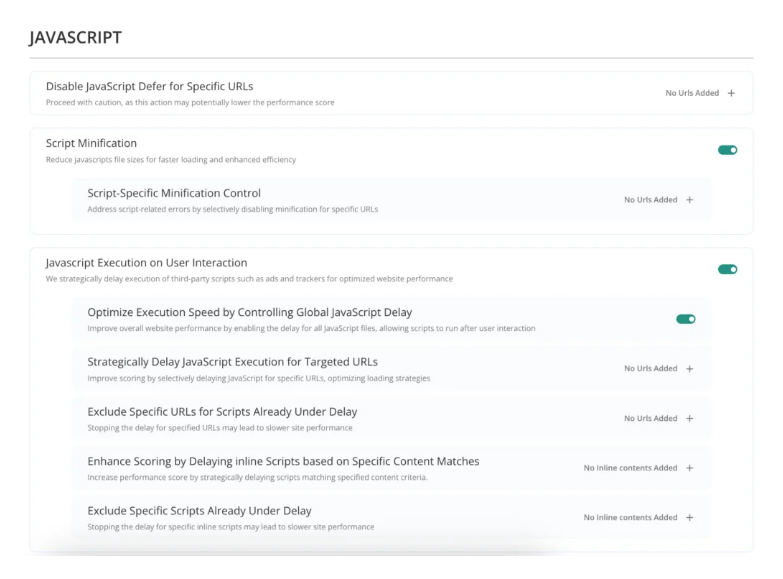
Be careful here. Delaying JavaScript can improve a lab score and break the thing the visitor came to use. Test real workflows, not only the report.
Poor CLS
Poor CLS means the page moves unexpectedly. Images pop into place. Ads push content down. Fonts swap after text appears. A banner loads above the article after the reader has started reading. The fix is usually practical: give unstable elements a fixed space before they load.
Poor TTFB
Poor TTFB means the browser waits too long before the server starts sending the page. On WordPress, that can point to hosting limits, cache misses, database overhead, plugin work, origin distance, or server configuration.
If TTFB is poor, image optimization alone will not solve the root problem. The browser cannot render a page it has not started receiving.
How to improve website performance metrics
Improve the metric closest to the visitor’s problem first. Then work backward to the cause.
Reduce LCP delay by making the main content lighter and easier to serve.
Resize and compress the main image.
Avoid slow hero sliders.
Improve page caching and CDN delivery.
Reduce render-blocking CSS and JavaScript.
Fix TTFB if the server responds slowly.
Improve INP by cutting the work that blocks clicks and taps.
Audit heavy JavaScript and plugin scripts.
Remove scripts from pages that do not need them.
Delay non-critical third-party tags carefully.
Test menus, forms, checkout, filters, and buttons after each change.
Stabilize CLS by reserving space before late content loads.
Set image and video dimensions.
Reserve space for ads, embeds, and banners.
Use font loading carefully.
Avoid injecting large elements above existing content.
Lower TTFB by improving the server response path.
Use page caching.
Add object caching where the site needs it.
Use a CDN for global visitors.
Review hosting limits and server configuration.
Reduce backend overhead from plugins and database work.
Reduce page weight by cutting what the browser downloads.
Stop loading plugin assets on pages that do not use them.
If your metrics point to common WordPress performance problems like caching, heavy CSS or JavaScript, image weight, font loading, and slow navigation, AirLift can help handle those optimizations in a WordPress-specific workflow. Treat it as a way to act on the metrics, not as a reason to stop reading them.
After any optimization pass, test the pages that make money or capture leads. A faster checkout that cannot complete payment is not an improvement. If you need help choosing settings for a sensitive workflow, contact AirLift support.
Track different metrics for different page types
Not every page has the same job, so not every page deserves the same priority.
Page type
Watch first
Why
Blog post
LCP, CLS, page weight
Readers need fast, stable content
Landing page
LCP, INP, CLS
The offer and CTA must load and respond
Product page
LCP, INP, image weight
Images, forms, and buttons must work fast
Checkout or form
INP, errors, uptime
Completion matters more than a pretty score
Template group
Core Web Vitals, TTFB, cache behavior
One template issue can affect many URLs
This is where people over-measure and under-decide. If checkout has poor INP, fix that before polishing a low-traffic archive page. If a blog post has poor conversion, speed may not be the cause. The content may simply be answering a different question than the visitor had.
Measure the page by the job it is supposed to do.
Common mistakes to avoid
Performance metrics help only when you use them with judgment.
Do not treat a 100 score as proof that the site is perfect. Field data, real workflows, and business outcomes still matter.
Do not treat page load time as the only metric. A page can load quickly and still jump around or ignore taps.
Do not open more tools before you know the question. More reports can make the problem look more serious without making the next decision clearer.
Do not assume every speed fix is harmless. Aggressive CSS and JavaScript settings can break navigation, forms, checkout, tracking, and layout.
Do not change performance settings without a recovery point. Keep a recent WordPress backup before editing caching, scripts, themes, or checkout behavior.
Do not expect field data to update immediately. Core Web Vitals field data reflects real users over time, so improvements may take weeks to show in Search Console or CrUX-backed reports.
The practical rule is simple: use metrics to guide decisions, not to create a permanent audit habit.
A simple routine for measuring performance
For most small and mid-sized WordPress sites, a weekly or monthly routine is enough. Check sooner after theme changes, plugin changes, redesigns, new ad scripts, new forms, checkout changes, or major template updates.
Start by checking Search Console for Core Web Vitals issue groups. Look for patterns by template, not just one noisy URL.
Run PageSpeed Insights on your 3 to 5 most important pages. Include mobile and desktop because they often show different problems.
Record the key numbers before you change settings. Capture LCP, INP, CLS, TTFB, and the most obvious diagnostic.
Fix the biggest user-facing pattern first. Start with the issue visitors feel most on the page that matters most.
Retest lab results right away and watch field data later. Lab data helps you confirm the change. Field data needs time.
For high-value ecommerce, membership, SaaS, or lead-generation sites, add monitoring or real-user measurement. If the site makes money, performance should not depend on someone remembering to run a manual test.
Conclusion
Website performance metrics are useful when they help you make a better decision. Start with LCP, INP, and CLS, then use TTFB, FCP, Speed Index, TBT, page weight, requests, uptime, and errors to find the cause. Keep the page’s job in view, because a checkout page, blog post, and landing page do not need the same priority order.
If the weak points are common WordPress issues, such as caching, image weight, heavy scripts, fonts, or slow server response, use a focused optimization workflow instead of guessing through settings. AirLift is a practical next step when you want WordPress performance optimization tied to the problems your metrics are already showing; review AirLift pricing once you are comparing effort against site value.
FAQs
What are website performance metrics?
Website performance metrics are measurements that show how fast, stable, responsive, and reliable a website feels to visitors.
What are the most important website performance metrics?
Start with LCP, INP, and CLS. Then use FCP, TTFB, Speed Index, TBT, page size, request count, uptime, and error rate to diagnose the cause.
Why does PageSpeed Insights change between tests?
PageSpeed Insights can change because lab tests depend on simulated devices, network behavior, and run-to-run noise. Field data is different because it reflects real users over a trailing 28-day period when enough data exists.
Should I use lab data or field data?
Use lab data to debug and compare changes. Use field data to understand what real visitors experienced over time.
What should I fix first on a slow WordPress site?
Fix the biggest user-facing bottleneck first. Start with LCP if the main content is late, INP if clicks feel delayed, CLS if the page jumps, and TTFB if the server is slow to respond.