

WordPress TTFB Very Slow? Find the Request That Is Waiting
PageSpeed’s “reduce initial server response time” warning can make a normal WordPress speed problem feel bigger than it is. If your report says WordPress TTFB very slow, the…
Read

Sometimes a site feels slow before any tool says it is slow. A page pauses on your phone. Checkout hesitates. A client sends you a PageSpeed score in the 40s, and now you are trying to work out whether the site is broken, the tool is strict, or you tested the wrong page.
To measure website speed properly, test the pages people actually use, start with PageSpeed Insights, read the metrics before the score, and retest the same URLs after each fix.
TL;DR: Use PageSpeed Insights first, test mobile and desktop, and focus on LCP, INP, CLS, TTFB, page weight, and request issues instead of the score alone. Then retest the same important pages after each fix so you know what actually improved.
A speed report is not a school grade. It is a set of clues. The useful question is not “How do I get 100?” It is “Which page is slow, what is slowing it down, and what should I fix first?”
A website speed test measures one page under one set of conditions. That detail matters more than people expect. A WordPress site can have very different pages:
Those pages do not all fail in the same way. Some are slowed by the server. Some are slowed by images. Some are slowed by browser work after the page appears.
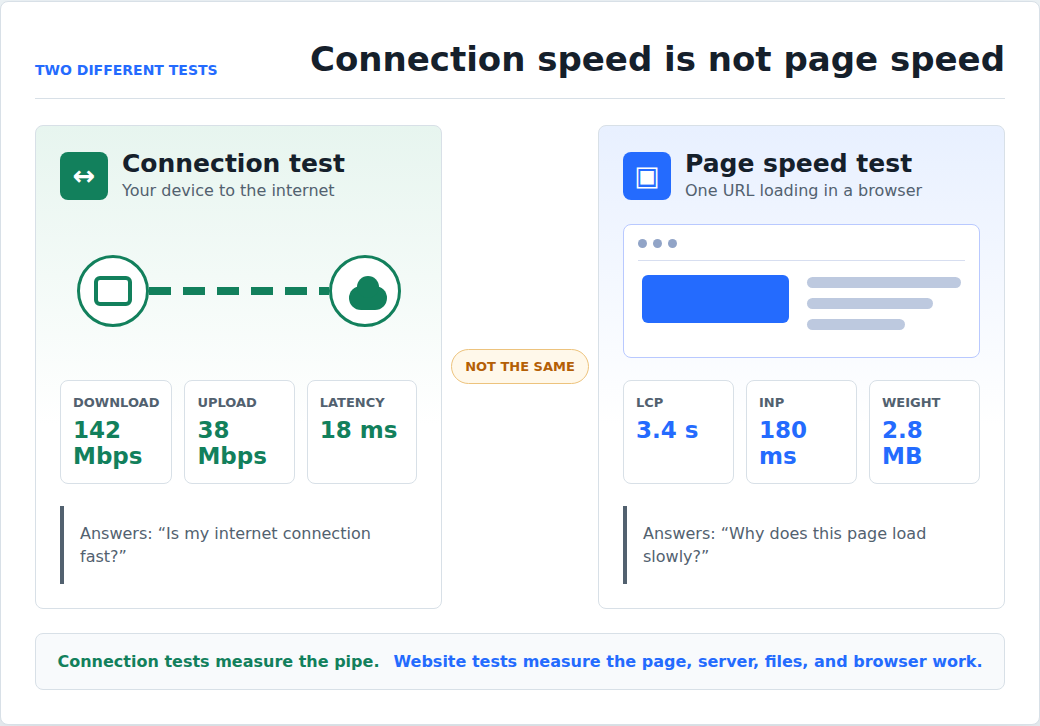
Also, an internet speed test is not a website speed test. Speedtest.net checks your own connection. It does not tell you whether your site has a huge image, slow hosting, too many plugin files, or a third-party script holding the page up.
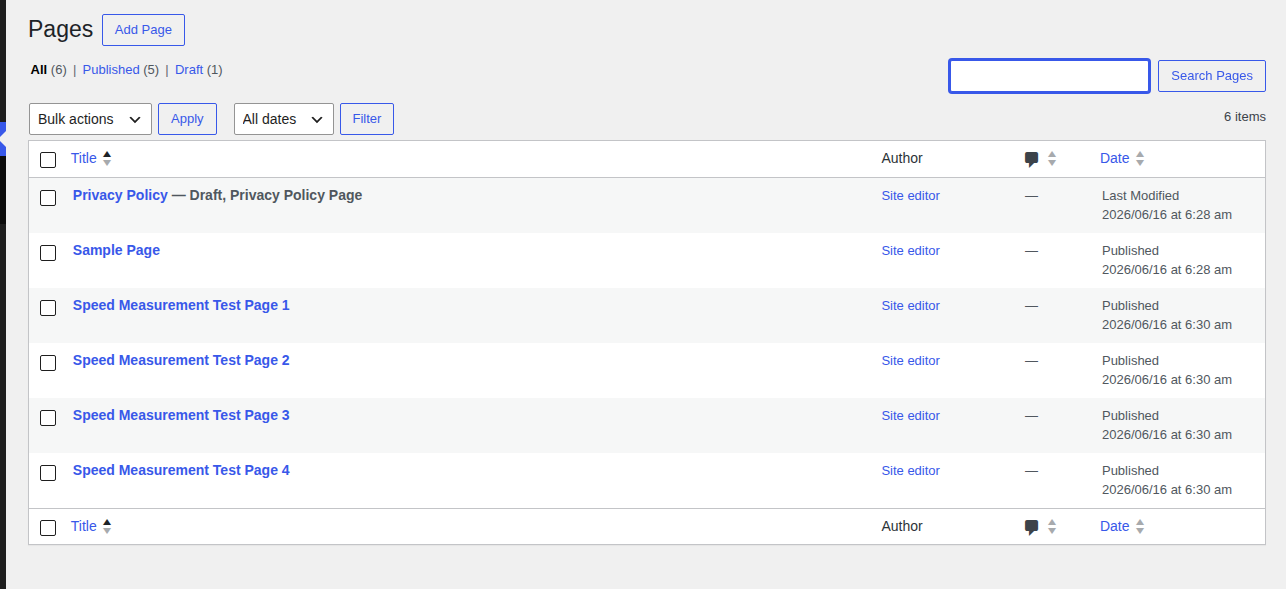
Test pages, not vibes. A green homepage does not prove your pricing page, checkout, or mobile landing page is fast.
The easiest URL to test is not always the page that matters most. Start with 3 to 5 URLs:
| Test this page | Why it matters |
|---|---|
| Homepage | First impression |
| Top traffic page | Where many visitors land |
| Main conversion page | Leads, sales, booking, signup, or pricing |
| Heaviest page | Images, video, ads, embeds, forms, or maps |
| Dynamic flow | Cart, checkout, account, search, or logged-in page |
If you only have time for one page, choose the page where slowness would hurt most. For a service site, that may be the contact page. For WooCommerce, it may be checkout. For a publisher, it may be the article template that gets most organic traffic.

The hidden WordPress trap is caching. Caching means saving a ready-made version of a page so the server does less work. It can make public pages look excellent while checkout still feels slow because checkout has to stay personal and current.
That is not a contradiction. It is two different page types doing two different jobs.
PageSpeed Insights is the best first tool for most site owners because it puts Core Web Vitals, mobile and desktop tests, field data, and lab diagnostics in one report.
Paste the exact URL, not just the domain. Run the report. Check mobile first. Mobile is usually harsher, which is useful. Phones have less processing power, mobile networks vary, and many visitors are not browsing from a perfect desktop setup on office Wi-Fi.
PageSpeed Insights can show two kinds of evidence:
If field data is missing, do not panic. It usually means Google does not have enough Chrome UX Report data, which is Google’s real-user speed dataset, for that page or site. Use the lab result as a starting point, then test more important URLs and look for patterns.
Read the Core Web Vitals assessment before you obsess over the big performance score.
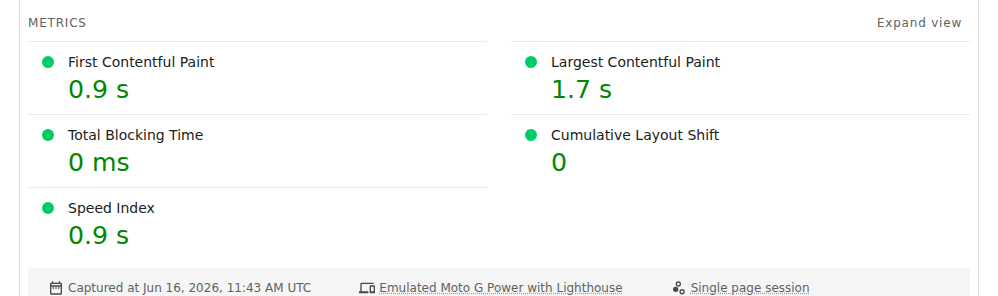
The score is the visible number. The metrics explain the job.
| Metric | Short meaning | Good target |
|---|---|---|
| LCP | Largest Contentful Paint, when the main content appears | 2.5s or faster |
| INP | Interaction to Next Paint, how quickly clicks and taps respond | 200ms or faster |
| CLS | Cumulative Layout Shift, how much the page jumps around | 0.1 or lower |
| TTFB | Time to First Byte, how fast the server starts replying | About 800ms or less |
| FCP | First Contentful Paint, when anything visible first appears | Faster is better |
| TBT | Total Blocking Time, lab clue that JavaScript is tying up the browser | Lower is better |
| Page weight | Total download size | Smaller is usually better |
| Requests | Number of files loaded | Fewer is usually easier |
The metric is the symptom. It is not the diagnosis.
Poor LCP may come from a huge hero image, slow server response, blocking CSS, late-loading fonts, or JavaScript delaying important content. A score alone will not tell you which one to fix. The warnings below the metrics usually will.
Speed results move around because test conditions move around. That does not make the reports useless. It means you need a baseline. Before changing anything, record:
Run each test more than once when you can. Trust the repeated pattern, not the strangest single run. One bad result can come from a cold cache, a busy server moment, or a slow outside script.
Choose a test region close to your audience when the tool allows it. If most customers are in the United States, a test from another continent may be useful for global checks, but it should not be your only baseline. A simple baseline log is enough, as long as it captures the same fields every time:
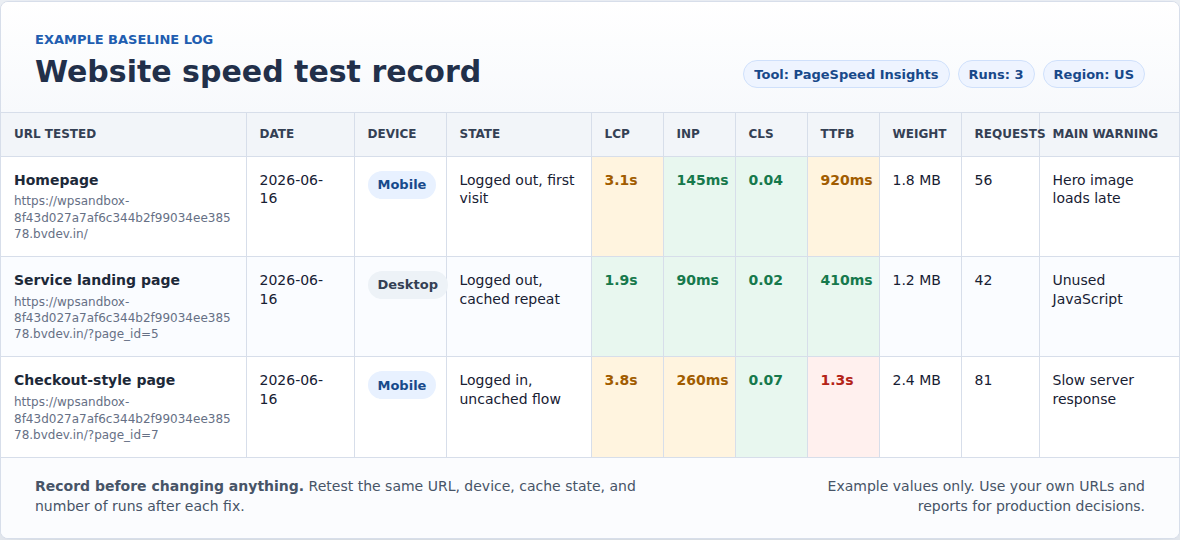
Do not collect reports for sport. Use another tool when PageSpeed Insights points to a problem but you need clearer evidence about files, locations, repeated runs, or real-user trends.
| Tool | Use it for |
|---|---|
| PageSpeed Insights | First Core Web Vitals check |
| GTmetrix | Waterfall, filmstrip, history, and readable sharing |
| WebPageTest | Device, location, network, browser, and repeat-run control |
| DebugBear | Core Web Vitals tracking and LCP breakdown |
| Uptrends or Pingdom | Simple location testing and monitoring |
| Search Console or RUM | Real-user trends over time |
A waterfall is a file-by-file loading chart. A filmstrip is a frame-by-frame view of how the page appears. RUM means real user monitoring, which tracks what visitors actually experienced instead of one lab run.
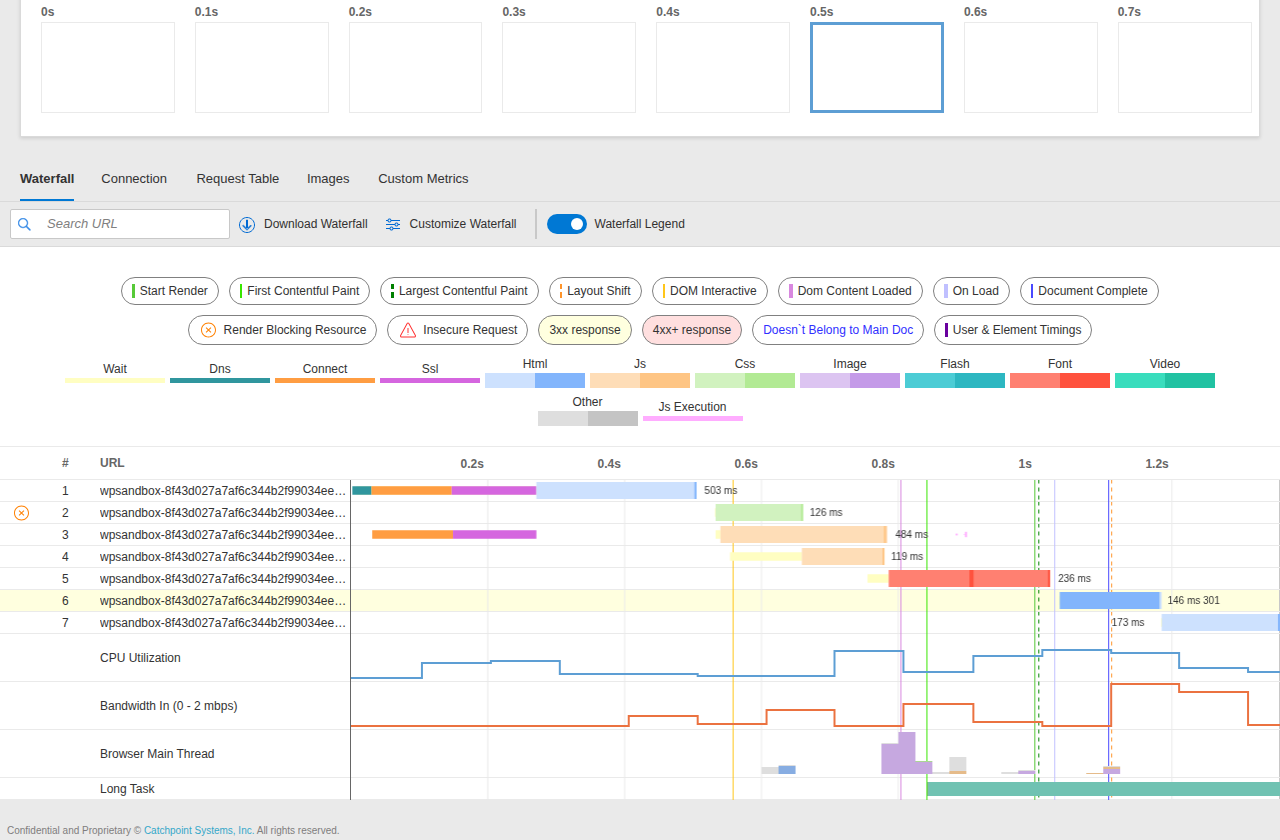
Different tools will not match perfectly. They use different devices, browsers, locations, connection speeds, cache states, and scoring systems. The mistake is trying to make every score agree. Look for repeated bottlenecks. If several tools point to slow server response, a large image, or heavy JavaScript, believe the pattern.
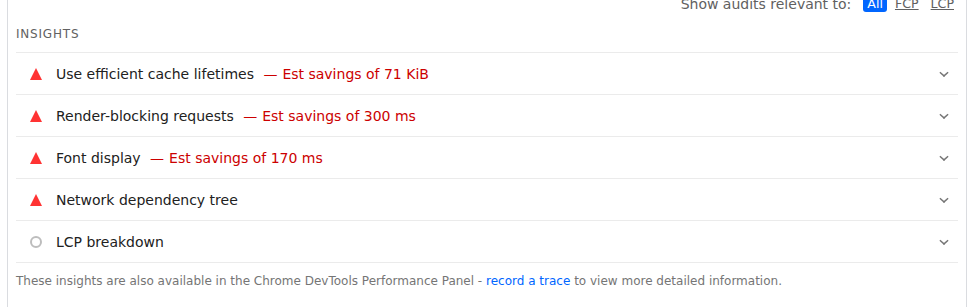
Once you have the numbers, match the weak metric to the likely cause. This is where the report becomes useful.
| If you see this | First place to look | First useful action |
|---|---|---|
| High TTFB | Hosting, caching, redirects, database work, CDN setup | Check whether the page is cached and whether the server is slow before the page loads |
| Poor LCP | Main image, server response, CSS, fonts, image priority | Inspect the largest above-the-fold element and how it loads |
| Poor INP or high TBT | Heavy JavaScript, plugin files, tracking tags | Find scripts that run for too long or load everywhere |
| Poor CLS | Images without sizes, ads, embeds, banners, font swaps | Find what appears late and pushes content around |
| Heavy page weight | Images, video, custom fonts, scripts, unused assets | Compress images, reduce font file size, or remove the largest files first |
| Too many requests | Plugin files, tags, embeds, fonts, third-party services | Remove or delay files that are not needed for the first view |
A slow WordPress page often has more than one cause. A large hero image can hurt LCP and page weight. A page builder can add CSS and JavaScript. A cookie banner can hurt CLS if it pushes content down after the page starts loading. If those patterns keep showing up, diagnose why your WordPress website is slow before changing settings.
Fix the bottleneck that affects important pages and repeats across tests. Do not spend your first hour polishing a minor warning on a page nobody visits.
Speed fixes can create new problems when they are stacked blindly. This is especially true on WordPress, where caching, JavaScript delay, CSS changes, lazy loading, and optimization settings can affect forms, menus, carts, tracking, and payment flows. Use this workflow:
That last step is not optional. Test menus, search, forms, popups, galleries, cart, checkout, account pages, payment methods, ads, analytics, and conversion events where relevant.
Do not stack multiple speed plugins that try to do the same job. Two tools both changing caching, CSS, JavaScript, fonts, or lazy loading can create conflicts that are harder to diagnose than the original speed issue.
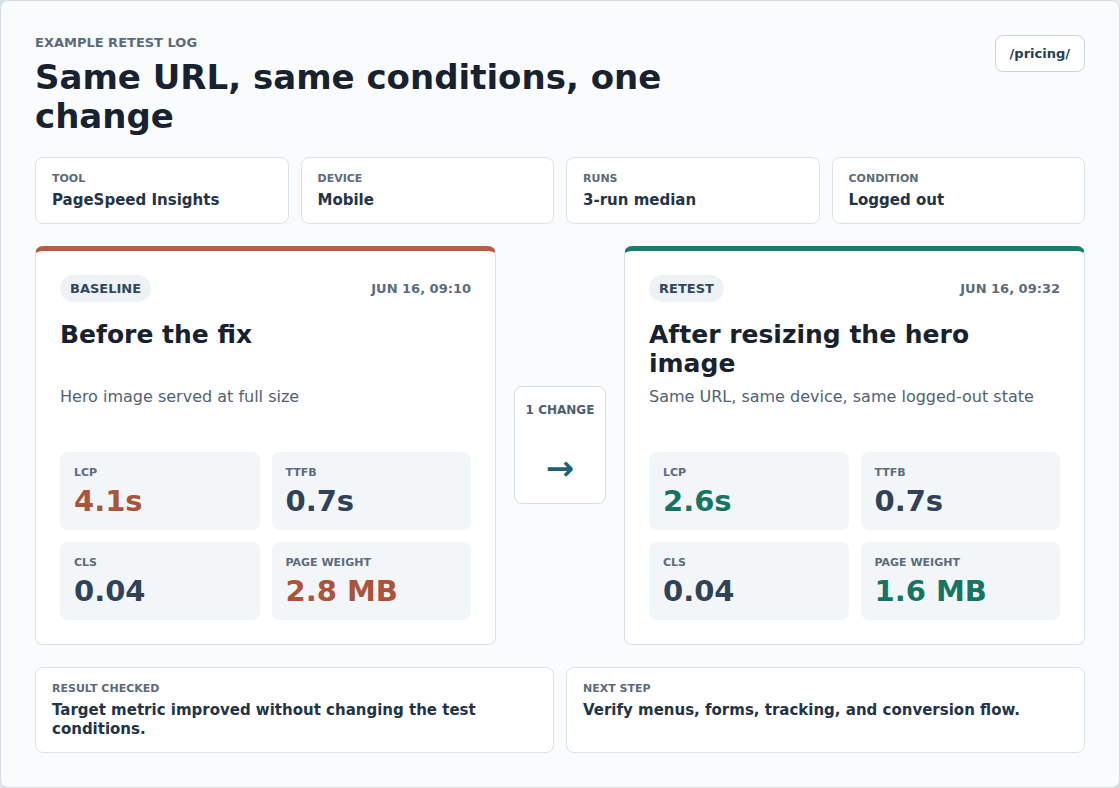
The practical rule is simple: change less, learn more. Once the baseline is saved and the weak metric is clear, move into WordPress performance optimization with the same one-change, one-retest discipline.
AirLift fits after measurement, not before it. The report should tell you whether a performance tool is likely to help.
AirLift is relevant when your WordPress speed reports point to common front-end and delivery problems: cacheable public pages, CDN delivery, image weight, CSS, JavaScript, fonts, navigation prefetching, Core Web Vitals work, or ongoing performance reporting. CDN means content delivery network, a set of servers that can serve files from locations closer to visitors.
It is less likely to be the complete answer when the bottleneck is weak hosting, exhausted PHP workers, slow database queries, fragile checkout logic, custom code, or a slow third-party service.
Use AirLift when the measured bottleneck matches what it handles. If the fit is clear and you are comparing costs, check AirLift pricing before you apply the change. If you are unsure whether the report points to AirLift or to hosting, code, or a third-party service, contact AirLift support before you change production settings.
Save your baseline first, retest the same URLs, and check your important flows. That is the honest way to use any performance tool. Let the measurement choose the fix.
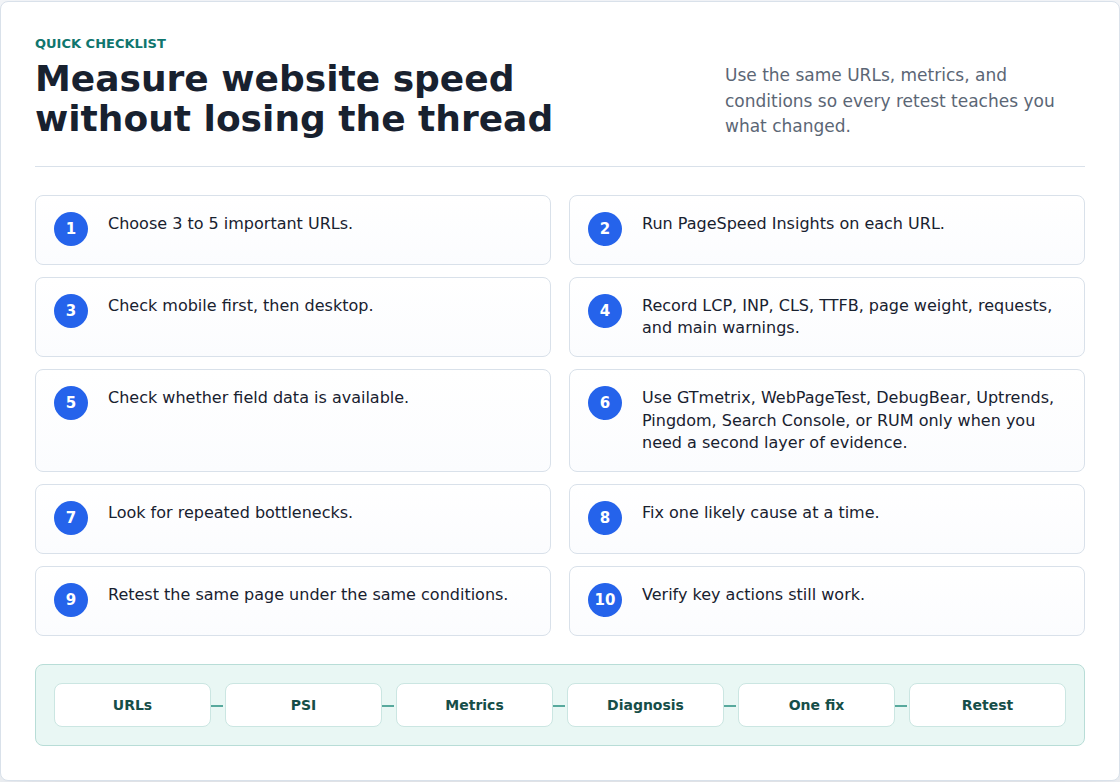
Use this when you want a useful baseline without turning the day into a full audit.
PageSpeed Insights is the best free first tool for most site owners. It gives mobile and desktop results, Core Web Vitals, field data when available, and lab diagnostics.
Use GTmetrix or WebPageTest when you need a waterfall, filmstrip, repeat runs, or clearer file-level detail.
A good score helps, but Core Web Vitals matter more. Aim for LCP at 2.5 seconds or faster, INP at 200 ms or faster, and CLS at 0.1 or lower.
Do not chase a perfect score if it breaks forms, checkout, analytics, ads, or design.
They test under different conditions: location, device, browser, connection speed, cache state, and scoring rules.
Compare repeated bottlenecks instead of expecting matching numbers.
Test mobile first for most sites. Mobile visitors often have slower devices and less stable networks, so mobile reports reveal problems desktop tests can hide.
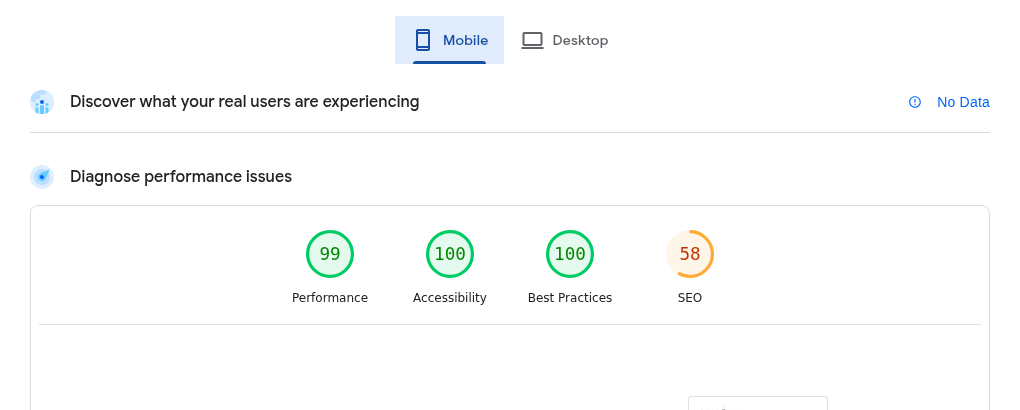
Then test desktop to see whether the issue affects everyone or mainly mobile users.
No. Speedtest.net measures your own internet connection. It does not measure whether your website’s server, images, scripts, fonts, plugins, or third-party tags are slowing down a page.
Measure important pages after major design changes, plugin changes, tracking changes, hosting changes, campaigns, and new page launches.
For busy or revenue-critical sites, check trends regularly in Search Console, a monitoring tool, or real user monitoring. Manual tests are useful, but they should not be the only way you notice performance problems.
Find the weak metric first. High TTFB points toward hosting, caching, redirects, CDN, or backend work. Poor LCP points toward the main image or content path. Poor INP or TBT points toward JavaScript. Poor CLS points toward layout movement. Fix one likely cause, retest the same page, and check that key site actions still work.
Measuring website speed is not about finding one perfect number. It is about testing the right pages, reading the metrics that explain the score, and finding the first problem worth fixing.
Start with PageSpeed Insights. Test mobile and desktop. Save your baseline. Confirm repeated patterns with another tool only when needed. Then change one thing, retest the same page, and protect the parts of the site visitors actually use.
PageSpeed’s “reduce initial server response time” warning can make a normal WordPress speed problem feel bigger than it is. If your report says WordPress TTFB very slow, the…
Read

Speed reports are blunt. You search for “leverage browser caching WordPress” because a tool has handed you a list of file URLs, and now a normal WordPress slowdown feels like…
Read

Sometimes your WordPress site looks loaded, but still feels late. The mobile menu ignores the first tap. A filter freezes after someone chooses a size. Search hesitates after every…
Read
Airlift works out what each page needs and applies it. Free to try on your own site.