

Browser Caching: What It Is and How It Speeds Up Your Website
You update a logo, reload the page, and still see the old one. PageSpeed says some files need a longer cache lifetime. A plugin promises to fix caching, your host already has…
Read

If you’ve searched for how to speed up Elementor, you’ve probably launched a page that looked perfect in the editor and now loads far too slowly, or the editor itself drags with every click. Every extra second on a slow website or page gives a customer another reason to close the tab and shop somewhere else.
We’ve watched this play out on a lot of WordPress sites, and the pattern rarely changes. Owners start flipping settings and disabling widgets, and that guesswork hides the real cause.
That is exactly why we compiled this guide from the sites we’ve seen recover fastest, so you can follow the same path: measure your website speed, find the biggest bottleneck, and fix it before anything else.
TL;DR: Find out whether the editor or the public page is slow, then fix the largest measured bottleneck before you change anything else. Retest after each change, and use AirLift to handle page caching, CDN delivery, and image optimization.
Elementor builds every page from sections, containers, and widgets, and that flexibility adds markup, stylesheets, and scripts a simple page wouldn’t need. Add large images and a few add-on packs, and the browser has a lot of work to do before your customers see anything.
On the sites we’ve seen, though, Elementor is rarely the main problem on its own. The biggest delays usually trace back to four causes:
Any one of these can be behind your slow page, so the first job is working out which part of the site is actually slow. If you’re choosing a tool to handle the fixes, compare WordPress performance optimization plugins based on the bottlenecks you’ve found.
A slow editor and a slow public page have different causes, so they need separate fixes. Editor lag shows up while you select widgets, open panels, or save. A slow public page shows up for your customers, who wait for the server, download large files, or watch content jump as it loads.
To track down editor lag, duplicate the page on a staging site, which is a private copy of your site for testing. Disable plugins you don’t need, switch to a lightweight theme like Hello Elementor, and see whether the editor speeds up. If it does, turn plugins back on one at a time until the lag returns, and you’ll have found the cause.
To test the public page, always load it logged out, on the same device and network, so each result compares fairly with the last. If the problem mainly affects phones, check the mobile experience separately from your desktop speed score.
📝 Note: Page caching speeds up the page your customers see, but it does nothing for the editor. If the editor is slow while the public page is fast, check your browser’s memory use, the size of the page, and plugin conflicts. If the whole dashboard feels sluggish too, follow these steps to diagnose a slow WordPress admin..
Once you know which side is slow, a speed test shows exactly where the public page loses its time.
An overall speed score tells you something is wrong, while the individual metrics tell you where to look. Understanding Core Web Vitals helps you distinguish loading, responsiveness, and layout problems. 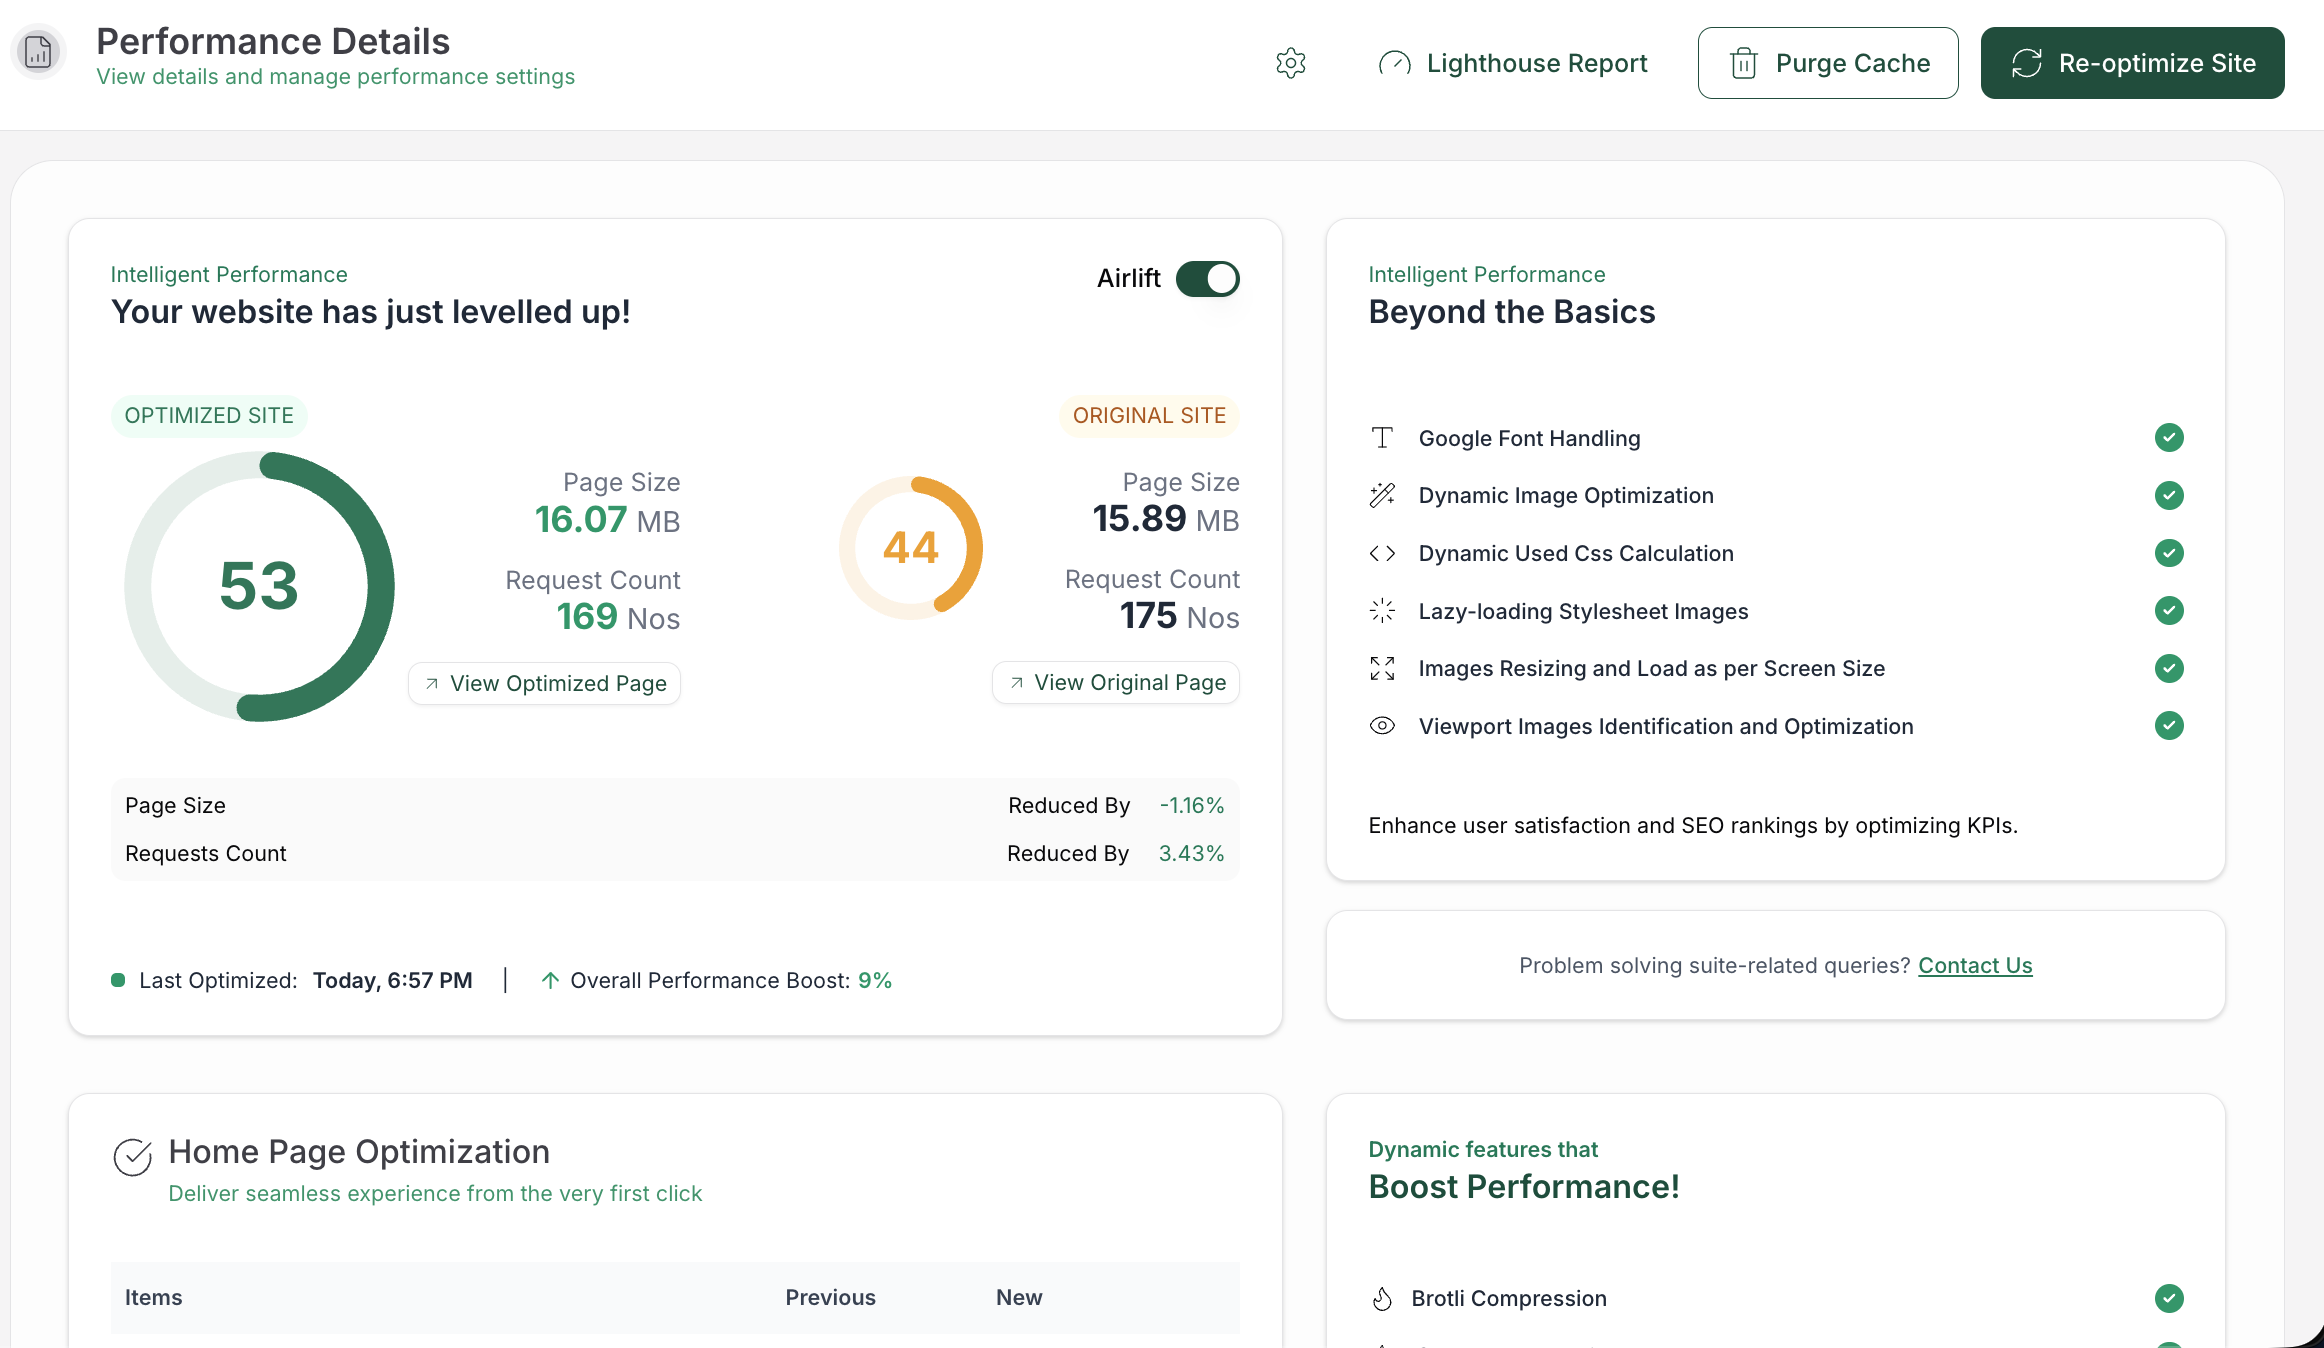
According to Google’s Core Web Vitals guidance, a page is healthy when LCP is 2.5 seconds or less, INP is 200 milliseconds or less, and CLS is 0.1 or less, measured across 75 percent of real visits.
| Metric | What it measures | Common cause of a poor score |
|---|---|---|
| TTFB (time to first byte) | How long the server takes to respond | Slow hosting, PHP, database work, or a cache that isn’t serving |
| LCP (largest contentful paint) | When the main content appears | A heavy hero image or a slow server response |
| INP (interaction to next paint) | How quickly clicks and taps respond | Heavy JavaScript from add-ons, chat tools, and analytics |
| CLS (cumulative layout shift) | How much the page jumps while loading | Images without set dimensions and late-loading fonts |
Let the failing metric choose your next fix. Compressing images won’t help a slow server, and a faster host won’t shrink an oversized hero image. The server is often the first thing a test flags, so that’s the natural place to start.
When the server responds slowly, every design change feels like it’s doing nothing. Load the page logged out and check whether your WordPress cache is working, since logged-in sessions, cookies, and some URL parameters skip the cache entirely. That’s how a page can feel fast to you while your customers still wait.
A content delivery network, or CDN, stores copies of your files on servers closer to your customers, which cuts the delay for people far from your host. It won’t speed up slow PHP or database queries, though. If time to first byte stays high on an uncached page, investigate the slow server response with your host before you redesign anything.
We’ve also seen plenty of sites running two or three caching plugins at once. Those overlapping layers serve stale content and make test results hard to trust, so choose one caching tool and turn off the rest. With the server responding quickly, the next biggest cost is usually what the page asks customers to download.
On most slow Elementor pages we’ve seen, images make up the largest share of the download. Open your browser’s network panel, sort the files by size, and start with whatever appears above the fold, the part of the page customers see before they scroll.
Resize each image to roughly the size it displays. A 2500-pixel photo shown in a 600-pixel slot makes every visitor download far more than they need. Follow these WordPress image optimization steps to resize and compress your images, and use WebP where your setup supports it.

Keep the hero image out of lazy loading. Lazy loading tells the browser to wait on images until someone scrolls near them, which works well below the fold. Applied to the hero image, it delays the first thing your customers came to see and can worsen your LCP.

Set a width and height on every image and video, so the browser reserves the space before the file arrives and the layout stays still.
📝 Note: Background images added in Elementor sections often slip past the image settings you apply elsewhere. Check them separately in the network panel, because they’re a common source of oversized downloads.
Once the images are lighter, the scripts that run on the page usually become the next thing holding it back.
Every add-on pack, widget library, chat tool, map, and analytics tag adds files your customers’ browsers have to load and run. One add-on pack that loads on every page can cost more than several small plugins that load only where they’re needed.

Pick your slowest page and list every widget and integration on it. For each one, check whether the page actually uses it and whether a form, menu, or template depends on it. Disable only what’s truly unused, then test your forms, menus, and pop-ups to confirm nothing broke.
Fonts deserve the same review. Every extra family and weight is another file to download, so keep only the ones your design uses and recheck your headings and layouts after any change. With fewer scripts in the way, the page structure is the last major source of weight.

Sections nested inside sections, duplicated responsive content, and stacked animations all create extra code for the browser to process. Elementor’s flexbox containers build the same layouts with fewer wrapper elements, so use them for new pages and major redesigns.
Work through the page in the editor, combining repeated wrappers, removing widgets that add nothing, and trimming animations that play on every scroll. Check the mobile layout separately too, because hiding a widget on mobile doesn’t always stop its files from loading.
Once the structure is clean, Elementor’s own performance settings can take you the rest of the way.
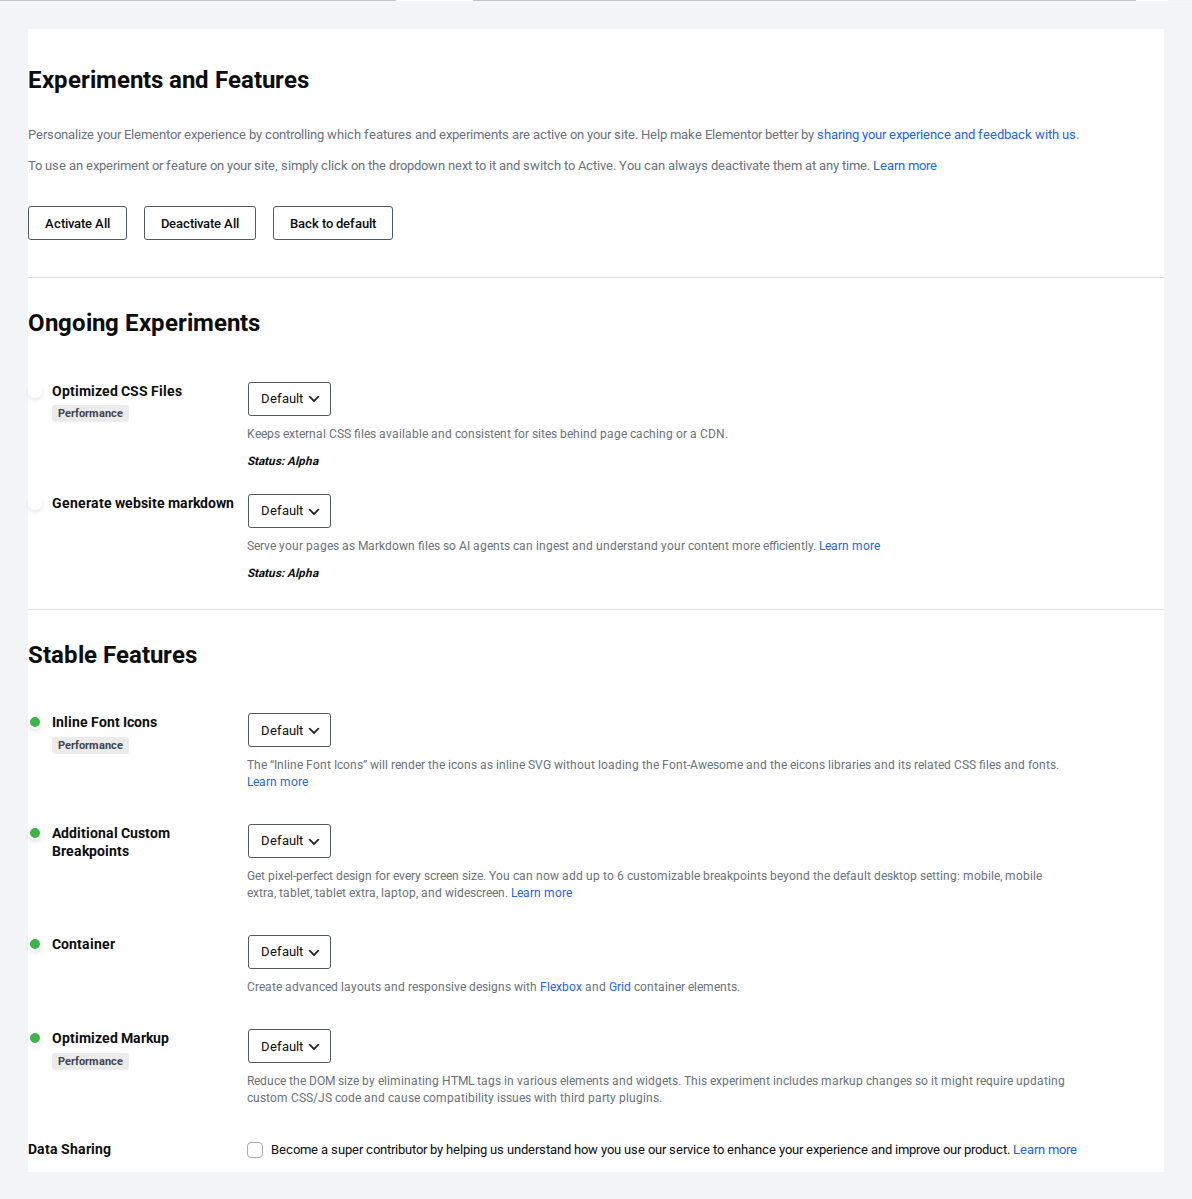
Elementor’s Performance and Features settings change how your assets load, and their names and defaults change between versions. Check what your installed version offers, and treat each setting as a test you can undo.
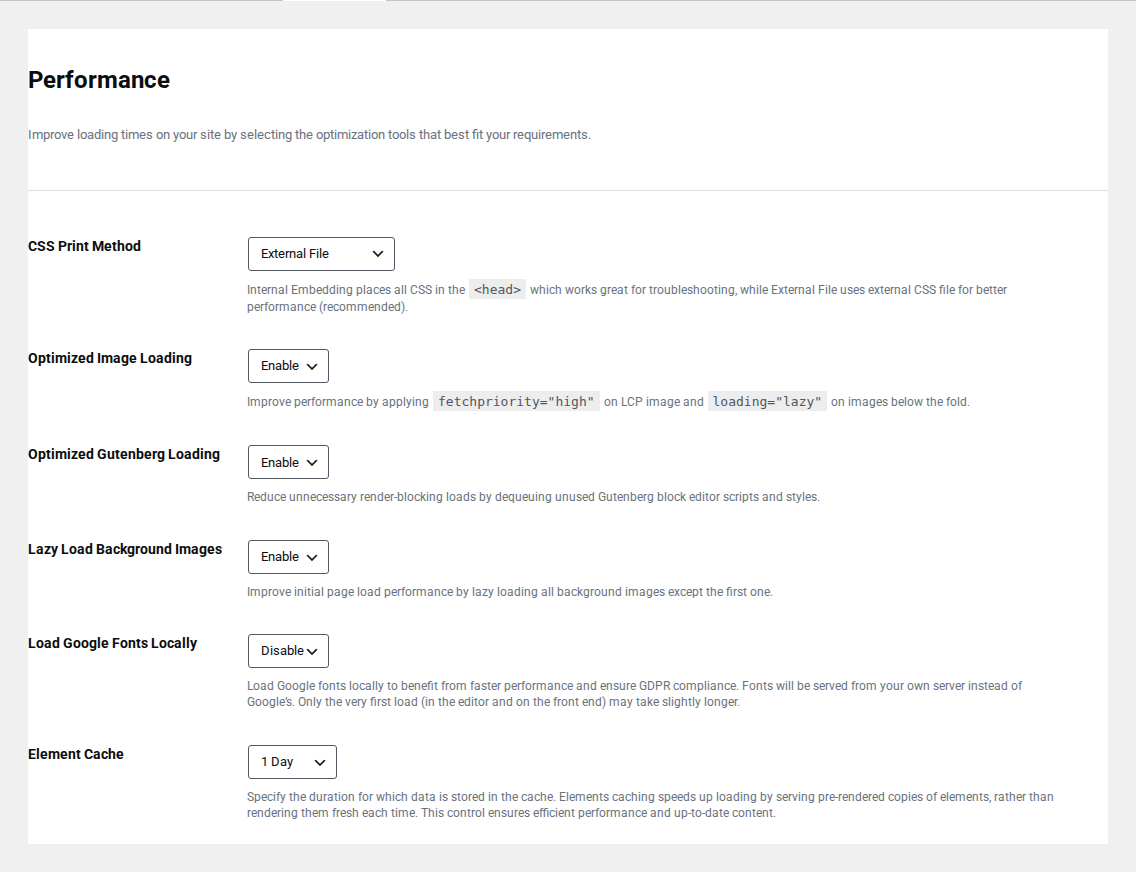
Change one setting at a time, clear the relevant WordPress cache, check your browser console for new errors, and test your forms before you keep it.
Every fix you’ve made only counts if it holds, which is why the last step is checking your work.
After every meaningful change, recheck the same page logged out, on desktop and mobile:
A better score that comes with a broken checkout or contact form is a step backward, so give that last check as much attention as the first.
Keeping every layer tuned by hand gets tiring as your site grows. AirLift handles page caching, CDN delivery, image optimization, and delayed loading of non-essential scripts in one place, helping you maintain the improvements without constant manual adjustments.
Most speed fixes leave the design untouched, such as resizing images and removing unused scripts. Settings that change markup or fonts can shift layouts, so test those on staging and compare the pages side by side before going live.

Usually not. The sites we’ve seen recover their speed kept Elementor and fixed their hosting, images, and scripts instead. Rebuilding on another builder costs far more time and rarely solves a slow server or oversized media.
Yes, because your theme loads its own files on every page. A lightweight theme like Hello Elementor gives the builder less to compete with, which helps both the editor and the public page.
Not for most of it. Resizing images, cleaning up plugins, and testing settings one at a time are all manageable on your own. Bring in your host or a developer when time to first byte stays high or a setting breaks custom code.
Caching and image fixes show up as soon as the cache refreshes. Core Web Vitals data in Google’s reports updates more slowly, since it reflects real visits collected over about four weeks.
That slow page you launched almost always has one main cause, and now you know how to find it. Learning how to speed up Elementor comes down to a clear order: separate the editor from the public page, read the failing metric, and fix the biggest bottleneck before anything else.
Retest after every change, keep only what works, and let AirLift hold onto the gains. Your next step takes five minutes: run a logged-out speed test on your slowest page and fix the first thing it flags.
You update a logo, reload the page, and still see the old one. PageSpeed says some files need a longer cache lifetime. A plugin promises to fix caching, your host already has…
Read

If you’ve tried to enable caching and visitors are now seeing old CSS, outdated content, or a private page from the wrong cache, the cache control header is a key place to…
Read

You clicked Update, refreshed the page, and the live site still looks old. The image is unchanged. The menu is wrong. In some cases, a slow website can also point to an outdated…
Read
Airlift works out what each page needs and applies it. Free to try on your own site.