

Browser Caching: What It Is and How It Speeds Up Your Website
You update a logo, reload the page, and still see the old one. PageSpeed says some files need a longer cache lifetime. A plugin promises to fix caching, your host already has…
Read

Your host says your WordPress site is using too much CPU. Maybe the dashboard has turned red, wp-admin is crawling, or visitors are seeing timeouts. That can feel alarming, especially when the warning gives you a number but no clear explanation of what caused it.
The good news is that high CPU usage does not automatically mean your site is broken, hacked, or in need of a bigger hosting plan. Like a slow WordPress website, it is a symptom that requires you to identify which layer is doing too much work.
This guide will help you understand what the warning means, what the numbers can and cannot tell you, and how to approach the problem with confidence before deciding what to do next.
TL;DR: Treat high CPU usage as an alarm, not a diagnosis. Compare the spike with hosting metrics, logs, traffic, PHP workers, database activity, scheduled tasks, and recent site changes. Run a WordPress performance audit to identify the overloaded layer, then test the most likely cause over the period when the problem normally returns. Restore, replace, escalate, or upgrade based on the evidence, and keep a current backup while you investigate.
Start by reconstructing the incident window, as if you were reading the smoke alarm’s panel after it sounded. Write down the date, start time, peak time, end time, visible symptoms, and anything that changed shortly before it. A sharp burst, a steady rise, a repeating interval, and a spike that began after an update suggest different next checks.
Compare CPU with memory, disk I/O (reading and writing data), worker usage (the request slots handling work), traffic, PHP errors, database activity, and web-server logs. High CPU with a burst of requests points to a different problem than high CPU with normal traffic and a slow WordPress server response. If the site is slow only in wp-admin, follow a separate process to diagnose a slow WordPress admin dashboard instead of assuming the public site is causing the CPU spike.
Ask your hosting support for attribution, not only whether CPU was high. Request the process category, timestamps, affected URL or task, source IP, user agent, and whether PHP, MySQL, cron, disk I/O, or traffic used most of the resource. Ask whether they can identify a slow query, a long-running PHP request, overlapping jobs, or a worker limit. Your host can often see this information even when you cannot.
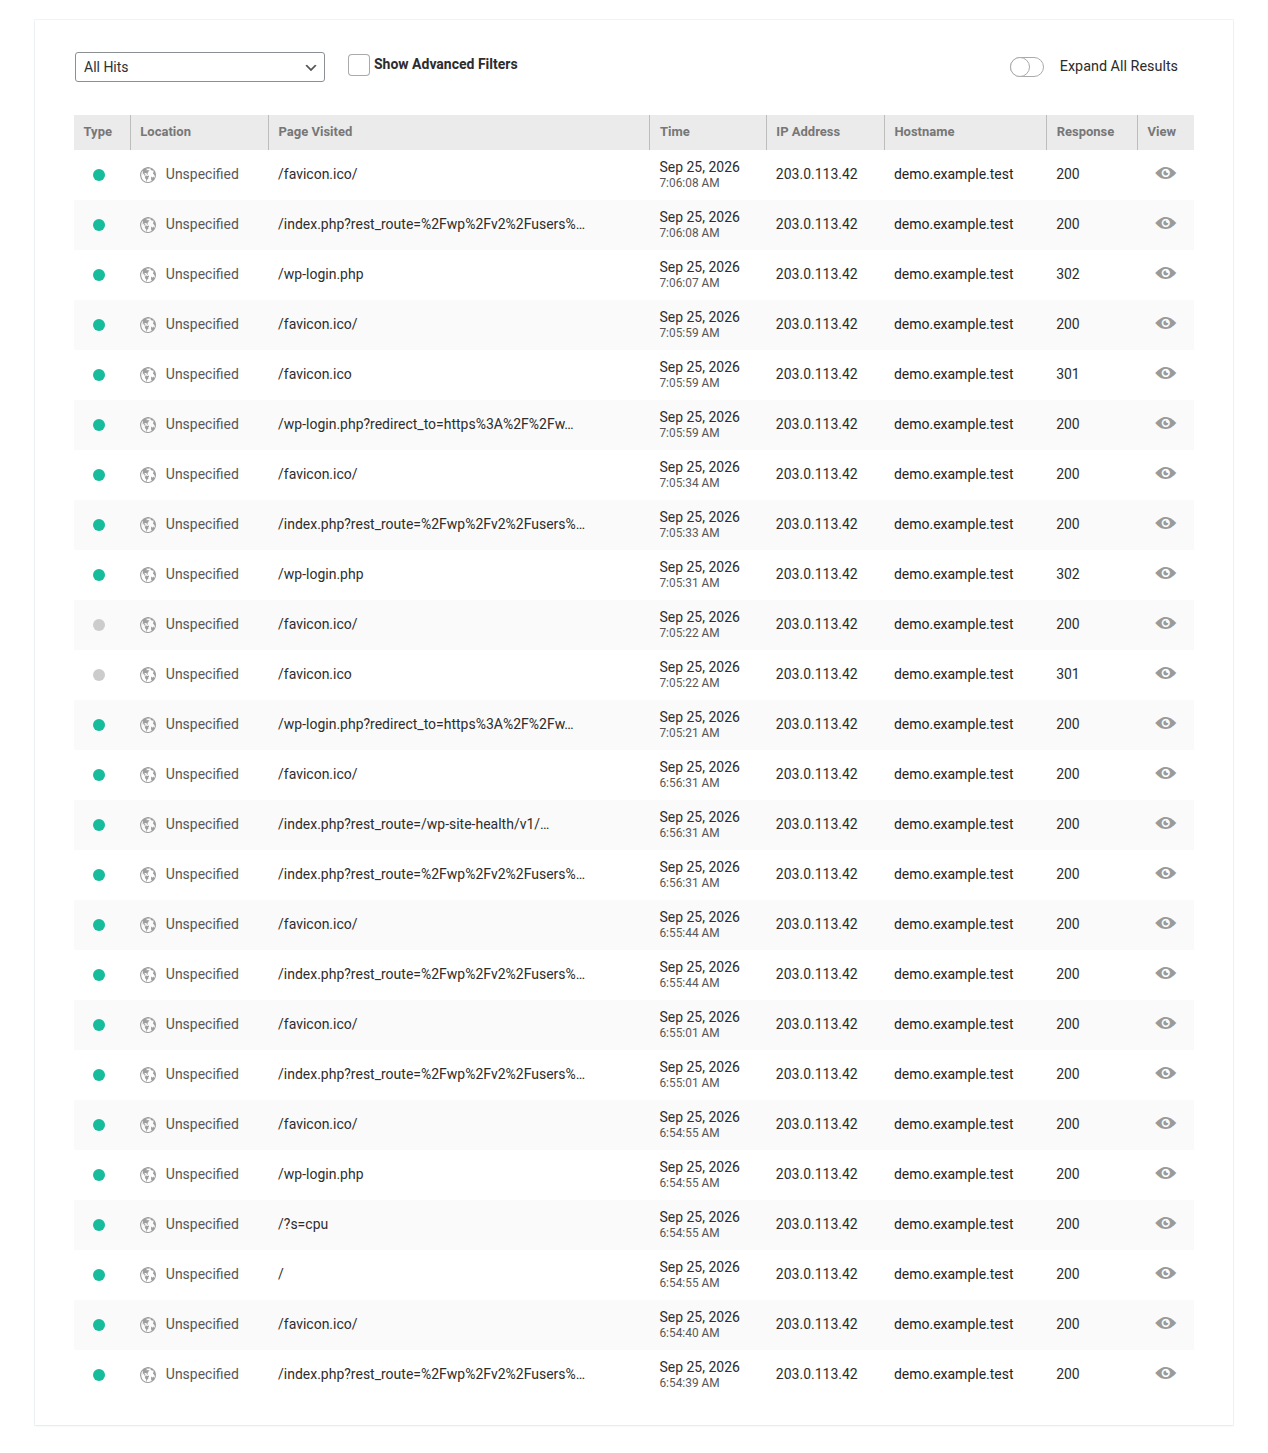
Keep the host’s response with your incident notes. The useful answer is not just “your account reached 100% CPU.” It is “requests to this URL from these clients dominated the window,” or “a scheduled PHP task and a database query were active at that time.”
Once you have the alarm’s timestamp and supporting details, the shape of the spike gives you a practical first test. It is a clue, not proof, so use it to choose the safest place to look next.
Do not blame the newest or largest plugin from the pattern alone. A theme, database query, cron callback, bot, or hosting limit can create the same graph.
With the alarm’s pattern pointing to ordinary public requests, ask whether WordPress is rebuilding the same cacheable page over and over. If host data shows that it is, WordPress page caching can reduce repeated PHP work by serving a completed page instead of making PHP and the database rebuild it for every visitor An edge or CDN (content delivery network) layer can serve cached content closer to visitors. A web application firewall, or WAF, and a rate limit can stop unwanted requests before they reach WordPress.
Caching helps only when the evidence shows repeated, cacheable frontend work. It does not automatically fix slow SQL, wp-admin requests, checkout, personalized pages, uncached pages, or a background job that runs independently of frontend traffic. It can also hide the problem temporarily, only for the load to return when the cache is purged, bypassed, or affected by WordPress caching issues.
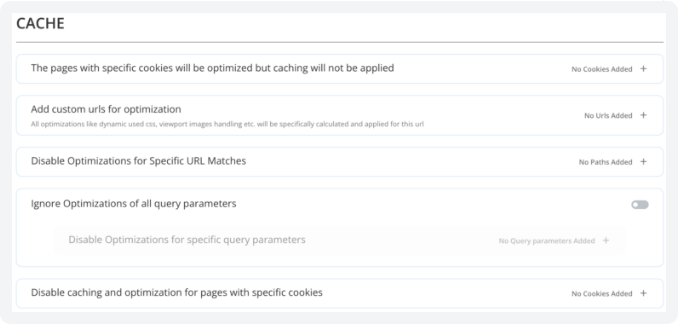
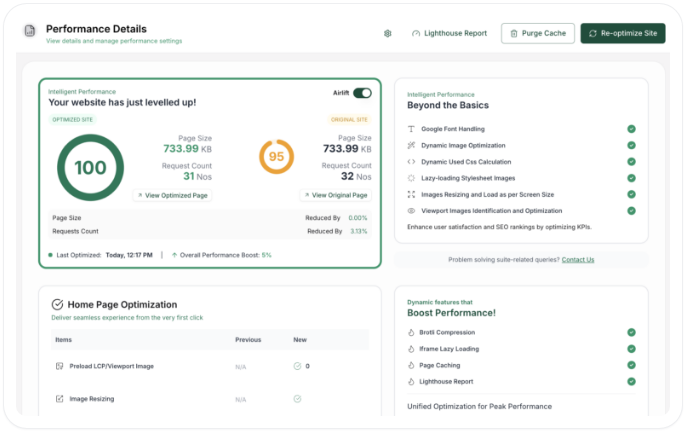
After you identify repeated cacheable frontend or origin work, review the current AirLift offering and confirm that its documented capabilities match the request type you measured. Treat it as a targeted option for that workload, not as a universal answer to high CPU. If the evidence points to a broken plugin, a slow query, malicious traffic, overlapping cron jobs, or inadequate infrastructure, address that cause first.
If caching does not match the evidence, move to the application layer without silencing the alarm by taking your live site apart. Use a staging site or a planned maintenance window for an important site. Take a verified backup and record the active theme, plugins, scheduled tasks, and relevant settings before changing anything. Deactivating every plugin on production can break forms, checkout, security, caching, integrations, and scheduled work.
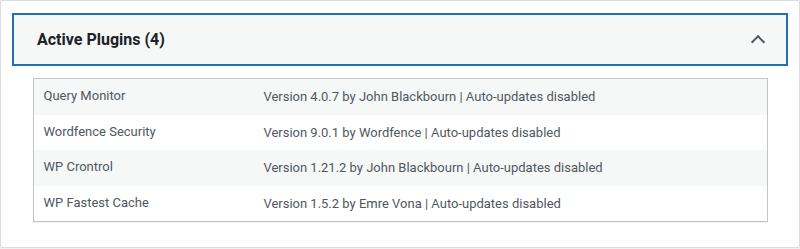
A controlled baseline is evidence, not permission to take a live site apart. Create one with a default theme and all plugins disabled only when your site can tolerate that state. Check the same request or workflow that was associated with the spike. If the load falls, restore the theme and plugins one at a time, allowing the site to run through the normal recurrence window after each change. A short quiet period is not proof that the problem is gone if the incident normally returns hourly or daily.
📝 Note: The mistake I see most often is treating the fastest-looking test as the safest one. When one component is associated with the problem, confirm the finding with a second observation before replacing it. Check its settings, recent changes, logs, and interactions with the theme or other plugins.
Do not delete an unused plugin or clear application data before preserving logs that may explain the incident. The right fix may be an update, a configuration change, a replacement, or a report to the developer.
If the application baseline does not explain the alarm, account for work that happens without a visitor waiting on a page. WP-Cron, backups, malware scans, imports, updates, cache purges, and cache preloaders can create periodic or bursty load. Match each task’s schedule and duration to the CPU window. Look for jobs that overlap, run more often than needed, retry after failure, or preload a large site after every purge.
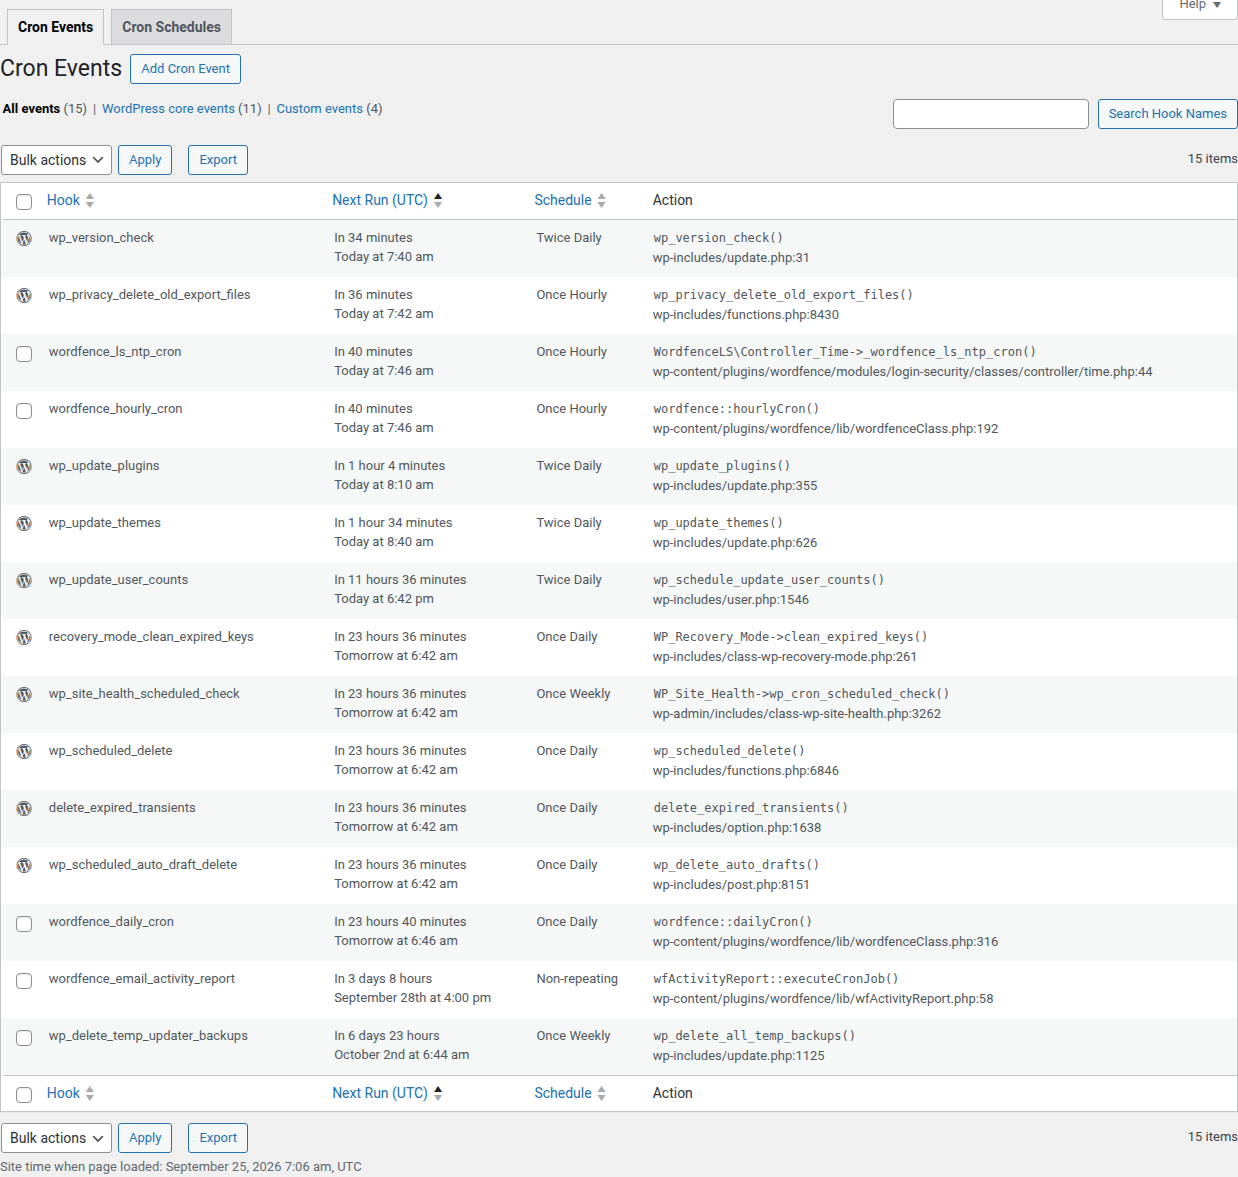
Replacing WordPress’s visitor-triggered cron with a system scheduler can make execution more predictable on a busy site, but it is not automatically a fix. The schedule still needs to match your site’s workload. Rescheduling a job too frequently can create more overlap, while disabling it can stop backups, imports, updates, or other essential work.
📝 Note: Here’s where people usually trip up: Heartbeat requests are periodic browser-to-server checks; autosaves, revisions, and XML-RPC (a remote publishing interface) may also contribute to request volume in specific workflows. Reduce or restrict them only after checking how your site uses editorial collaboration, mobile publishing, integrations, and authentication.
A setting that lowers CPU can also break publishing or a connected service.
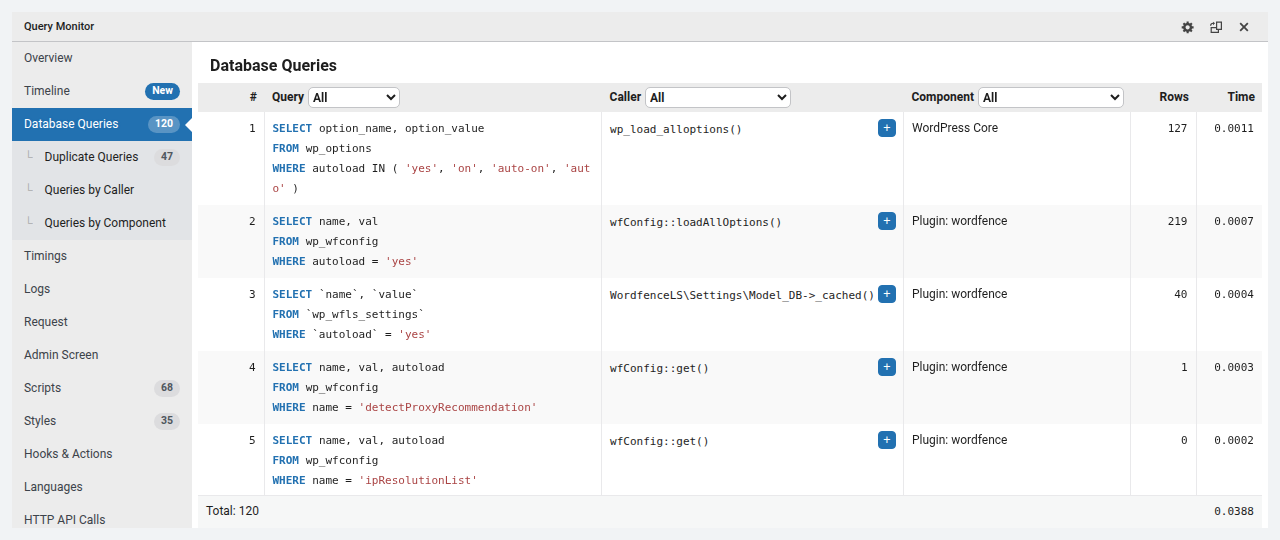
Scheduled work is only one kind of application work, so follow the alarm into the database and PHP layer when the timing points there. A slow database query can keep PHP, the language WordPress runs on, open while the application waits. On database-heavy or dynamic sites, WordPress object caching may reduce repeated database work, but only after you confirm that repeated queries are part of the bottleneck. Expensive joins, broad postmeta lookups (searches of WordPress metadata), wildcard searches, grouping, and ordering can be involved. Signs may include slow admin screens, aborted database connections, or statement-time-limit messages. These are examples of evidence to investigate, not proof that every high-CPU WordPress incident is a database problem.
Ask your host or a qualified developer for the slow query, the request that triggered it, and the tables or plugin code involved. Preserve the query and its timestamp before changing the database. A query profiler or monitoring plugin can provide useful evidence, but it can also add overhead, so limit temporary diagnostics and remove them when they are no longer needed.
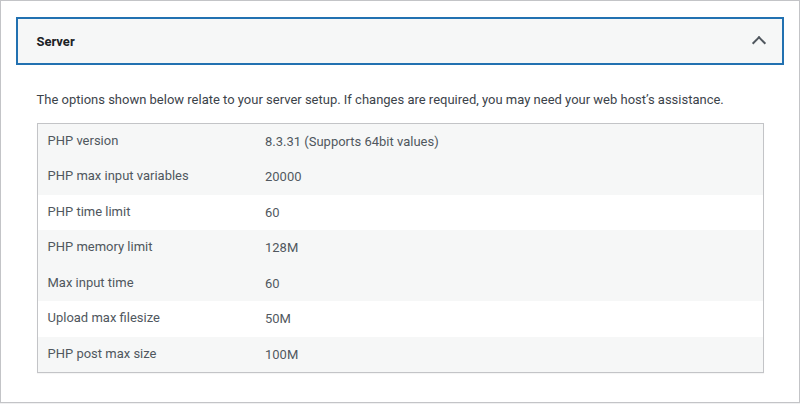
PHP memory, maximum execution time, worker limits, CPU, and disk I/O are different resources. More memory will not make a CPU-heavy callback efficient. A longer execution limit can allow a bad request to occupy a worker for longer. A worker limit can make the site appear blocked even when CPU is not the only bottleneck. Inspect the failing request and your host’s resource attribution before changing a limit. If the delay occurs before WordPress sends the page, investigate why WordPress TTFB is unusually slow before changing PHP or memory settings.
If the query and application checks do not explain the alarm, look at who or what is asking your site to work. Unusual traffic can create high CPU through public requests, login attempts, XML-RPC calls, or repeated requests to expensive URLs. Compare normal and abnormal request patterns. Look for a sudden increase from a small number of IP addresses, unusual user agents, repeated login failures, unknown URLs, or processes that you did not start.
If the evidence suggests malicious traffic or an infection, preserve logs and use the appropriate firewall, host, or malware-response process. A scan is evidence to evaluate, not proof that the site is infected. Do not disable security controls simply to make the CPU graph quieter. Blocking a legitimate integration or turning off protection can create a larger operational and security problem.
A post-update spike is also a correlation clue, not proof of a universal WordPress core defect. Compare your site’s theme, plugins, traffic, PHP version, and configuration with the update timeline. If many sites appear unaffected, the cause may be an interaction with one theme or environment. Verify any version-specific incident before rolling back or pausing security updates.
Once the possible causes are separated, choose the smallest reversible change that tests the leading explanation. For a traffic test, compare request volume and origin work after filtering or rate limiting. For a plugin test, compare the same workflow with the component disabled on staging. For a cron test, compare the next normal run after separating or rescheduling the task. For a cache test, compare cache hits and origin requests, not just the CPU graph.
Use the same recurrence window that produced the incident. Record the change, the exact time it took effect, the related host metrics, and the user-visible result. Use a consistent method to measure WordPress website performance before and after the test, and check whether any scheduled or editorial workflow failed. If the CPU drops but errors increase, the change did not solve the problem. Restore the previous state when the test is inconclusive or causes a regression.
If a controlled test still leaves the cause unclear, escalation is the right next step. Escalate to your host when you cannot identify the process, the site is timing out, logs are unavailable, or your host reports a resource ceiling without attribution. Provide the incident window, recent changes, symptoms, URLs, and the tests already performed. This gives support something more useful than a request to “make WordPress faster.”
Upgrade or move hosting only when your host confirms a capacity ceiling after site-level causes have been excluded. More capacity can be the correct fix for a growing site, but it can also hide a software defect while increasing cost. Conversely, endless plugin tuning will not solve a genuine capacity ceiling.
It means the server is doing more work than its allocated capacity can handle. The graph does not say whether PHP, MySQL (the WordPress database), cron, traffic, bots, malware, cache behavior, or normal site growth caused the work. Match the CPU window to host attribution and logs before choosing a fix.
Yes. A plugin can create expensive PHP work, database queries, scheduled callbacks, or repeated requests. Test it by reproducing the affected workflow with the plugin disabled on staging or during a safe maintenance window, then restore components one at a time over the normal recurrence window.
Yes. Abnormal request volume, repeated login traffic, suspicious URLs, unknown processes, or unexplained changes can justify a security response. Review logs, preserve evidence, and block or clean the cause at the appropriate layer. Do not assume a scan alone proves or disproves an infection.
Caching can reduce repeated work for cacheable frontend requests. It does not automatically fix slow database queries, admin requests, checkout, personalized pages, background jobs, or malware. Confirm that origin requests and cache behavior match the diagnosed cause before treating caching as the solution.
Upgrade or move when your host confirms a capacity ceiling after application, database, scheduled-job, traffic, and security causes have been investigated. Ask whether CPU, workers, memory, or I/O is the limiting resource. Scaling is useful when the workload is legitimate and persistent, but it should not replace finding a runaway request or job. Once the CPU-specific problem is controlled, use a structured WordPress performance optimization process to improve caching, delivery, database health, frontend assets, and hosting without stacking unrelated fixes.
Once you know which work is consuming the CPU, the fix is usually less mysterious: remove or reschedule the offending job, correct the request or query, contain abusive traffic, or move to capacity that matches a legitimate workload. The graph becomes useful when it is attached to evidence.
At the next spike, make a short incident note and send it to your host. If the site is still timing out or the evidence points to a security event, escalate before making a broad change.
You update a logo, reload the page, and still see the old one. PageSpeed says some files need a longer cache lifetime. A plugin promises to fix caching, your host already has…
Read

If you’ve tried to enable caching and visitors are now seeing old CSS, outdated content, or a private page from the wrong cache, the cache control header is a key place to…
Read

You clicked Update, refreshed the page, and the live site still looks old. The image is unchanged. The menu is wrong. In some cases, a slow website can also point to an outdated…
Read
Airlift works out what each page needs and applies it. Free to try on your own site.