A slow website rarely feels like one neat technical problem.
The first screen stays blank. The menu ignores the first tap. A pricing block jumps just as someone tries to click the button. Then PageSpeed Insights adds a red warning, and the question what is website performance stops sounding abstract.
Website performance is how fast, stable, responsive, and usable a website feels when people load and interact with it. It includes load speed, Core Web Vitals, mobile experience, server response, visual stability, and perceived speed.
For a WordPress site, the practical path is simple: test one important page, find the biggest visible bottleneck, fix that first, and retest before changing anything else.
TL;DR: Website performance is how quickly and smoothly a page loads, responds, and stays stable for visitors. Start with one important page, test mobile and desktop, check Core Web Vitals, fix the biggest visible bottleneck, and retest before changing more.
What Website Performance Means
Performance is not one score. A page can finish loading in a reasonable time and still feel bad if the checkout button shifts, the mobile menu freezes, or the first screen stays empty while scripts load.
The real test is this: can visitors use the page without waiting, guessing, or fighting the layout? Website performance is the quality of the visitor experience while a page loads and responds.
For a WordPress site, that means the main headline appears quickly, images load without pushing text around, menus and forms respond when tapped, and mobile visitors can read or act without delay.
This is why perceived speed matters. A page that shows the headline, first paragraph, and main action quickly can feel faster than a page that waits for every font, tracker, widget, and script before showing anything useful.
Visitors do not care whether the delay came from hosting, a plugin, a large image, or a tracking tag. They feel the wait.
The visible problem is “this page is slow.” The hidden problem is usually messier: the browser may be waiting on the server, downloading an oversized hero image, processing plugin scripts, loading an oversized font, reserving no space for an ad, and trying to make all of that work on a phone.
That is why performance work starts with diagnosis, not guesswork.
Why Website Performance Matters
Performance matters because visitors judge the page while it is still loading.
If the page feels slow or unstable, people may leave before they read, buy, subscribe, book, or contact you. That hurts the work the page was built to do.
Visitors Feel The Delay Before They Understand It
Most visitors are not thinking about JavaScript, caching, or server response. They are trying to complete a task.
A service page that shows its message quickly and lets the form work can feel fine even if a chat widget loads later. A page that stays blank until everything is ready feels worse, even if the final load time looks similar. The visible experience matters more than the final load event.
SEO Still Starts With Usefulness
Google uses page experience signals, including Core Web Vitals, as part of how it evaluates pages. These signals look at loading performance, responsiveness, and visual stability.
Speed does not replace helpful content. A fast page with weak content is still weak. A useful page that matches search intent is still doing the most important SEO work.
Think of performance as support for good SEO. It removes a reason for visitors and search engines to distrust the page experience.
Conversions Depend On Attention
Slow pages spend attention before the visitor can act. On an e-commerce site, that may mean fewer people reach checkout. On a lead generation site, it may mean fewer form submissions. On a membership site, it may mean visitors never reach pricing.
Trust is part of this, too. If a payment button moves under someone’s finger, the site feels careless. Visitors may not know the phrase “layout shift,” but they know when a page feels unreliable.
Mobile Shows Problems First
Mobile exposes performance problems first.
Phones often have slower networks, smaller screens, and less processing power than desktops. Cookie banners, ads, sticky headers, and third-party scripts also take up more of the screen. Do not trust desktop results alone. They often test the easiest version of the site.
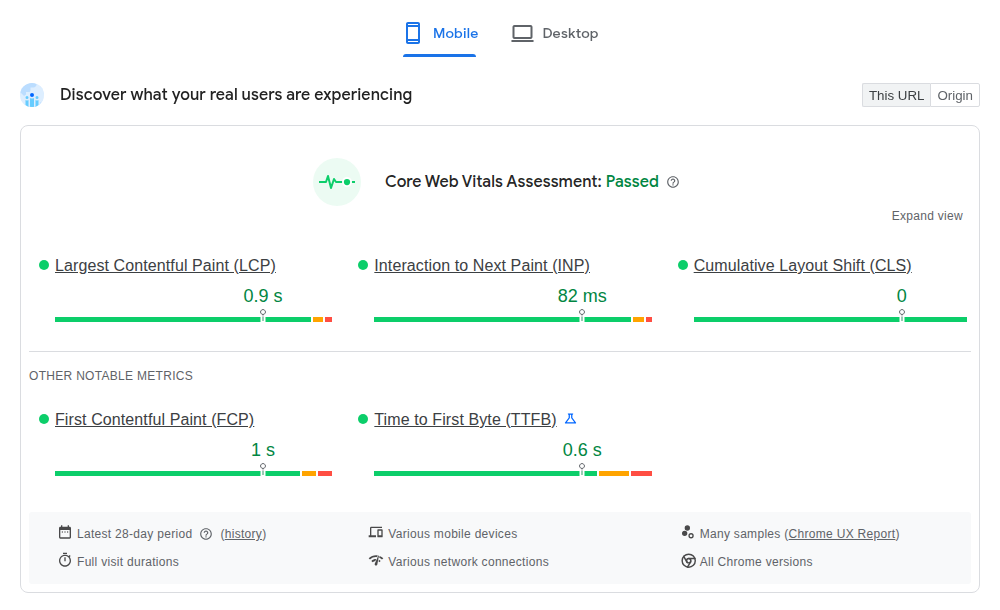
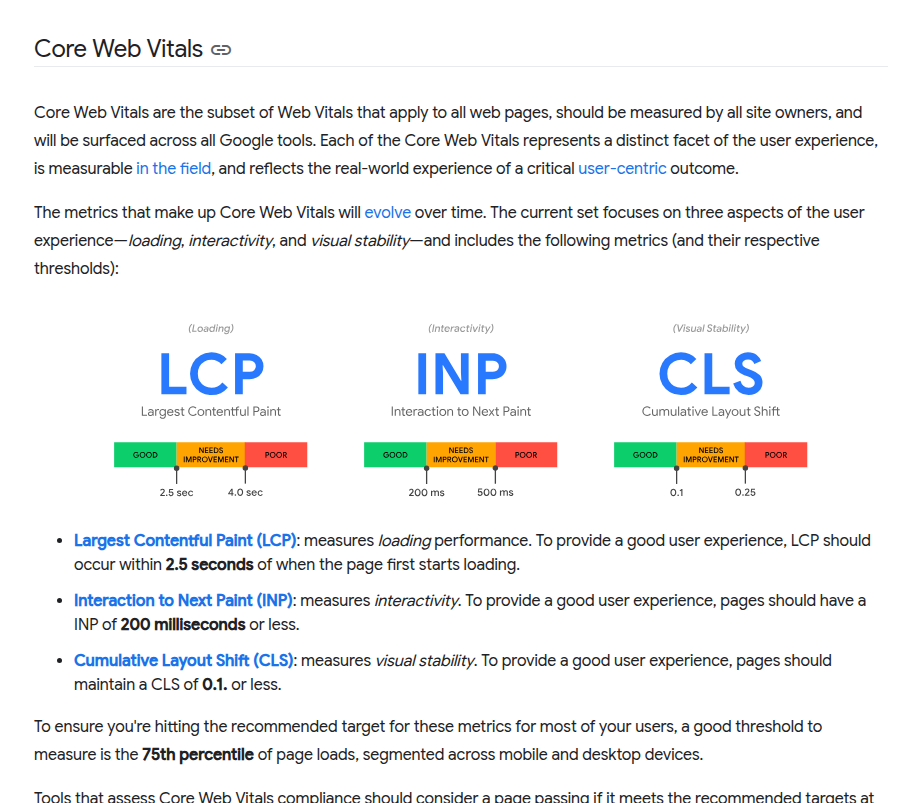
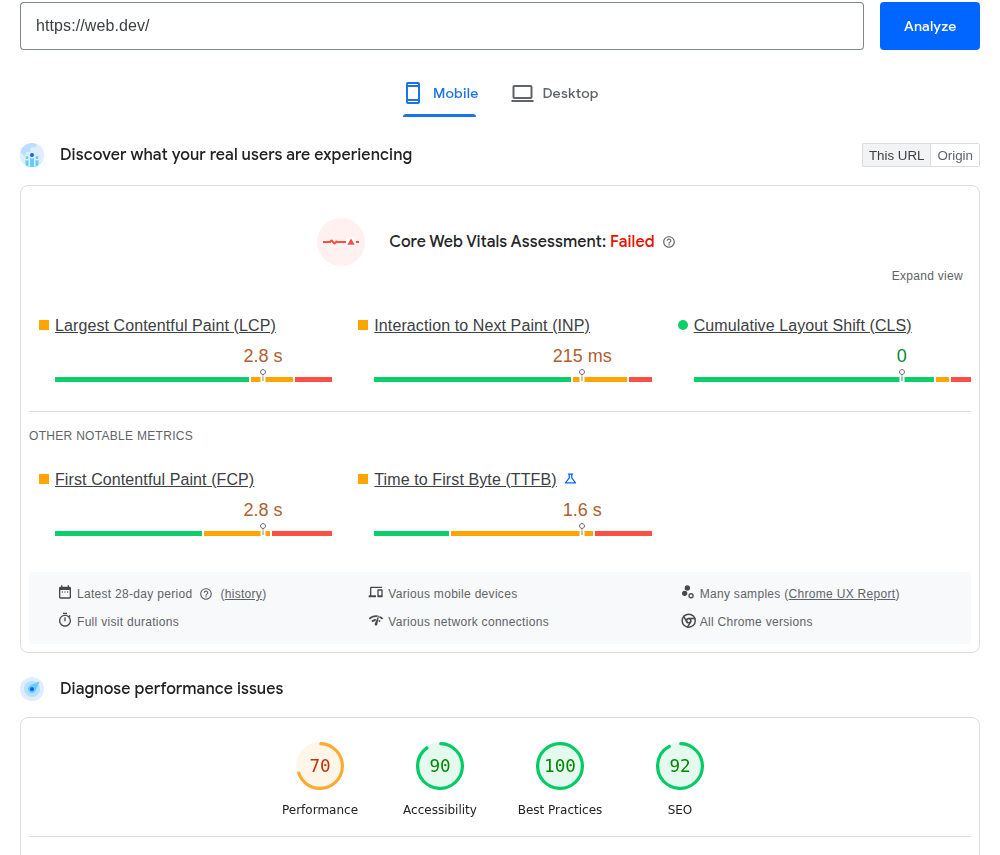
Start with Core Web Vitals. Google’s current good thresholds are Largest Contentful Paint of 2.5 seconds or faster, Interaction to Next Paint under 200 milliseconds, and Cumulative Layout Shift of 0.1 or lower.
Metric
What it tells you
Good result
LCP
Main content appears quickly
2.5s or faster
INP
Clicks, taps, and typing respond quickly
Under 200ms
CLS
The layout does not jump unexpectedly
0.1 or lower
That small table is the place to start. LCP tells you whether the visitor sees the important part of the page soon enough. INP tells you whether the page responds when they try to use it. CLS tells you whether the page stays still while they read or click.
Other metrics help when you need a deeper diagnosis:
FCP: when the first text or image appears.
TTFB: how long the server takes to start responding.
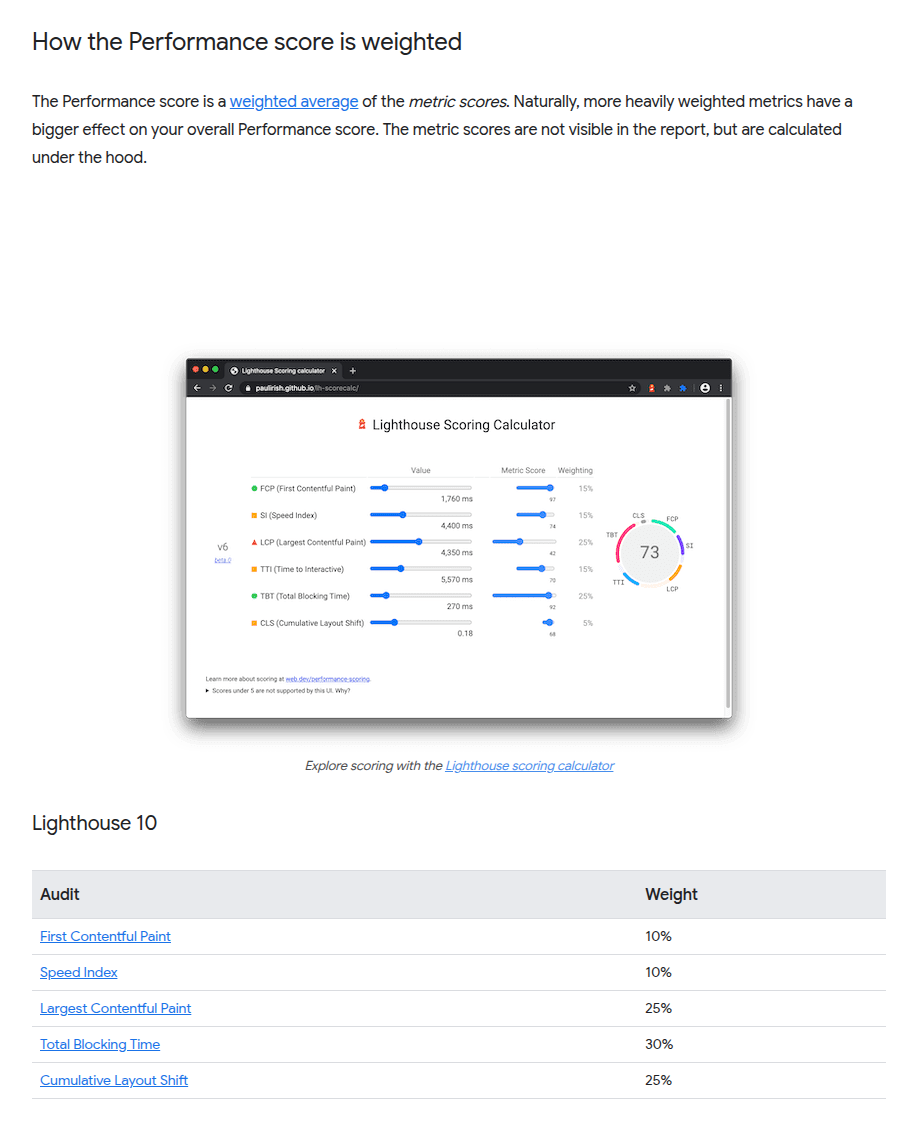
Speed Index: how quickly visible parts of the page appear.
TBT: how much scripts block responsiveness in lab tests.
Page size and request count: how much the browser has to download and request.
The useful truth is that these metrics are connected.
A huge hero image can hurt LCP. Too much JavaScript can hurt INP and TBT. Ads or embeds that load late can hurt CLS. Slow hosting can hurt TTFB and make every other issue feel worse. Use the metric to find the bottleneck. Do not collect warnings as a hobby.
Why Test Results Differ
Performance tools disagree because they measure different versions of reality.
Lab data comes from a controlled test. Lighthouse, PageSpeed Insights diagnostics, GTmetrix, and WebPageTest can show repeatable clues like large files, blocking scripts, slow server response, and layout shifts.
Field data comes from real visitors. Search Console’s Core Web Vitals report can show this when your site has enough data. Field data reflects actual phones, networks, browsers, locations, and behavior. Use lab data to debug. Use field data to understand what visitors are actually living with.
One bad test is not a full diagnosis. Run more than one test, check mobile and desktop separately, and look for patterns.
A page builder adds extra CSS. A plugin loads scripts on every page. Marketing adds tracking. Someone uploads a full-size image into a small banner. A font, an embed, a popup, and a chat widget each add a little more work.
None of those choices has to be reckless by itself. Together, they can make the page heavy.
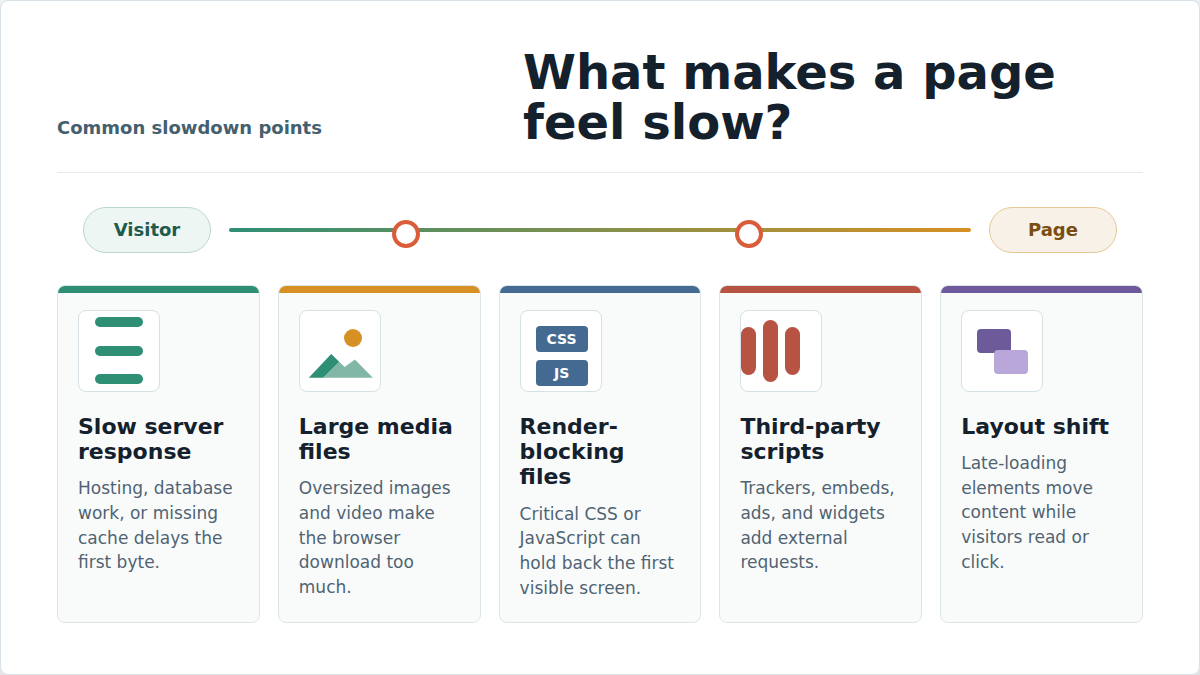
Common causes include:
Large images and videos: A full-size image used as a small banner still has to be downloaded unless it is resized or served properly.
Heavy plugins and themes: The issue is not plugin count alone. The issue is what each plugin loads on the front end.
Slow server response: Weak hosting, database overhead, traffic spikes, malware, and missing caching can delay the first response.
Render-blocking files: Some CSS and JavaScript stop the browser from showing the page until they are downloaded and processed.
No caching: WordPress may rebuild the same page again and again instead of serving a ready version.
No CDN: Visitors far from your hosting server may wait longer for images, CSS, and JavaScript.
Third-party tools: Redirects, fonts, ads, embeds, trackers, and widgets can all add delay, especially on mobile.
Where this goes wrong: site owners keep adding useful things without removing old ones.
An old campaign popup may still load. A social widget nobody checks may still call an external service. A slider may still ship files to every page even if it only appears on the homepage.
Performance cleanup often starts by removing work the page no longer needs.
How To Check Website Performance
Start with one important page, not the whole site.
Choose a homepage, landing page, high-traffic blog post, product page, pricing page, or checkout page. Record the baseline before changing anything.
Test mobile and desktop separately.
Use PageSpeed Insights first because it shows Core Web Vitals and lab diagnostics in one place.
Check LCP, INP, and CLS before chasing smaller warnings.
Use GTmetrix, Pingdom, WebPageTest, or Lighthouse when you need deeper waterfall or location testing.
Retest after each major change.
The beginner mistake is opening five tools, collecting twenty warnings, and changing everything in one afternoon. Do not do that. Pick the biggest visible bottleneck first.
If LCP is poor and the main image is huge, start with the image. If TTFB is slow and there is no caching, start with caching. If CLS is poor because images or ads load without reserved space, start there.
The metric is the symptom. The bottleneck is the job.
How To Improve Website Performance
The best first fix is usually the one that removes the most waiting with the least risk.
For most WordPress sites, start with images, caching, unnecessary scripts, and server response before chasing advanced tweaks.
Resize and compress visible images: Use the dimensions the page needs, compress files, use modern formats when possible, and lazy-load images or videos below the first screen.
Enable caching: Page caching helps WordPress serve ready pages faster. Browser caching helps repeat visitors. Object caching can help dynamic sites with heavy database work.
Use a CDN when distance matters: A CDN serves static files from locations closer to visitors. It matters more for national or global audiences than for a small local audience.
Remove scripts and embeds that no longer earn their place: Disable unused plugin features, remove old campaign tags, and replace heavy widgets when their business value is weak.
Handle CSS and JavaScript carefully: Deferring scripts, reducing unused CSS, and compressing files can help. These changes can also break menus, forms, sliders, tracking, or checkout if applied blindly.
Improve hosting when TTFB stays slow: Better hosting will not fix a huge page full of scripts, but it can help when the server is still slow after caching and cleanup.
Monitor after major site changes: New plugins, images, redesigns, landing pages, tracking tags, and traffic spikes can slow the site down again. For agencies managing many sites, WP Remote can centralize uptime, updates, backups, and reports.
Do not stack optimization plugins unless each one has a clear job. One plugin may minify JavaScript, another may defer it, another may combine it, and another may rewrite images. If you add focused features such as navigation prefetching, test the important pages after the change. When the mobile menu breaks, the settings become hard to untangle.
For WordPress users who want fewer moving parts, AirLift is a WordPress performance plugin that can help handle common performance layers such as caching, CDN setup, image optimization, CSS improvements, and Core Web Vitals support. The value is practical: one WordPress-focused workflow is easier to manage than several overlapping tools changing the same files.
Common Performance Mistakes
Performance advice gets messy when people treat test scores like trophies.
The goal is not a perfect report. The goal is a fast, stable, usable page that still does its job.
Do not chase a perfect score at the cost of the page. Do not remove useful content, break tracking you need, or flatten the design just to make a number look cleaner.
Do not trust desktop results by themselves. Mobile visitors often get the slower, less forgiving version of the experience.
Do not treat speed as the whole SEO strategy. Performance supports SEO. It does not replace relevance, helpful content, crawlability, internal structure, or authority.
Do not fix every warning at once. Change one major thing, test the important pages, and then continue.
Do not ignore business-critical pages. Checkout, logged-in pages, forms, membership areas, and booking flows may need special caching or script handling.
A speed report is useful only if it helps you make the site better for real visitors.
Conclusion
Website performance is not about making a report look pretty. It is about making the page usable before the visitor runs out of patience.
If you are learning website performance for the first time, start with the visitor’s experience. Does the main content appear quickly? Can people click, tap, type, and submit without delay? Does the layout stay still? Is mobile acceptable? Is the server responding quickly? Is the page carrying files or scripts it no longer needs?
For a WordPress site, the next step is straightforward: test one important page, fix the largest bottleneck, and retest. If the problems are spread across caching, image optimization, CDN setup, CSS, scripts, and Core Web Vitals, AirLift is a sensible next step because it puts the common WordPress performance jobs in one workflow. If you need help deciding where to start, AirLift support can help you choose the right next step.
FAQs
What is website performance?
Website performance is how quickly and smoothly a website loads, displays useful content, responds to visitors, and stays visually stable while people use it.
Why is website performance important?
It affects user experience, SEO, conversions, mobile engagement, and trust. A slow or unstable page makes it harder for visitors to read, click, buy, subscribe, or contact you.
What are the main website performance metrics?
The main Core Web Vitals are Largest Contentful Paint, Interaction to Next Paint, and Cumulative Layout Shift. Other useful metrics include First Contentful Paint, Time to First Byte, Speed Index, Total Blocking Time, page size, and request count.
How do I check website performance?
Use PageSpeed Insights first, and check mobile and desktop separately. Use Search Console for real-user Core Web Vitals data when enough data is available.
What slows down website performance?
Common causes include oversized images, heavy JavaScript, too many front-end plugin files, third-party scripts, slow hosting, missing caching, redirects, render-blocking CSS or JavaScript, fonts, ads, and embeds.